Chromatic Dispersion of R G & B Rays
£0.00
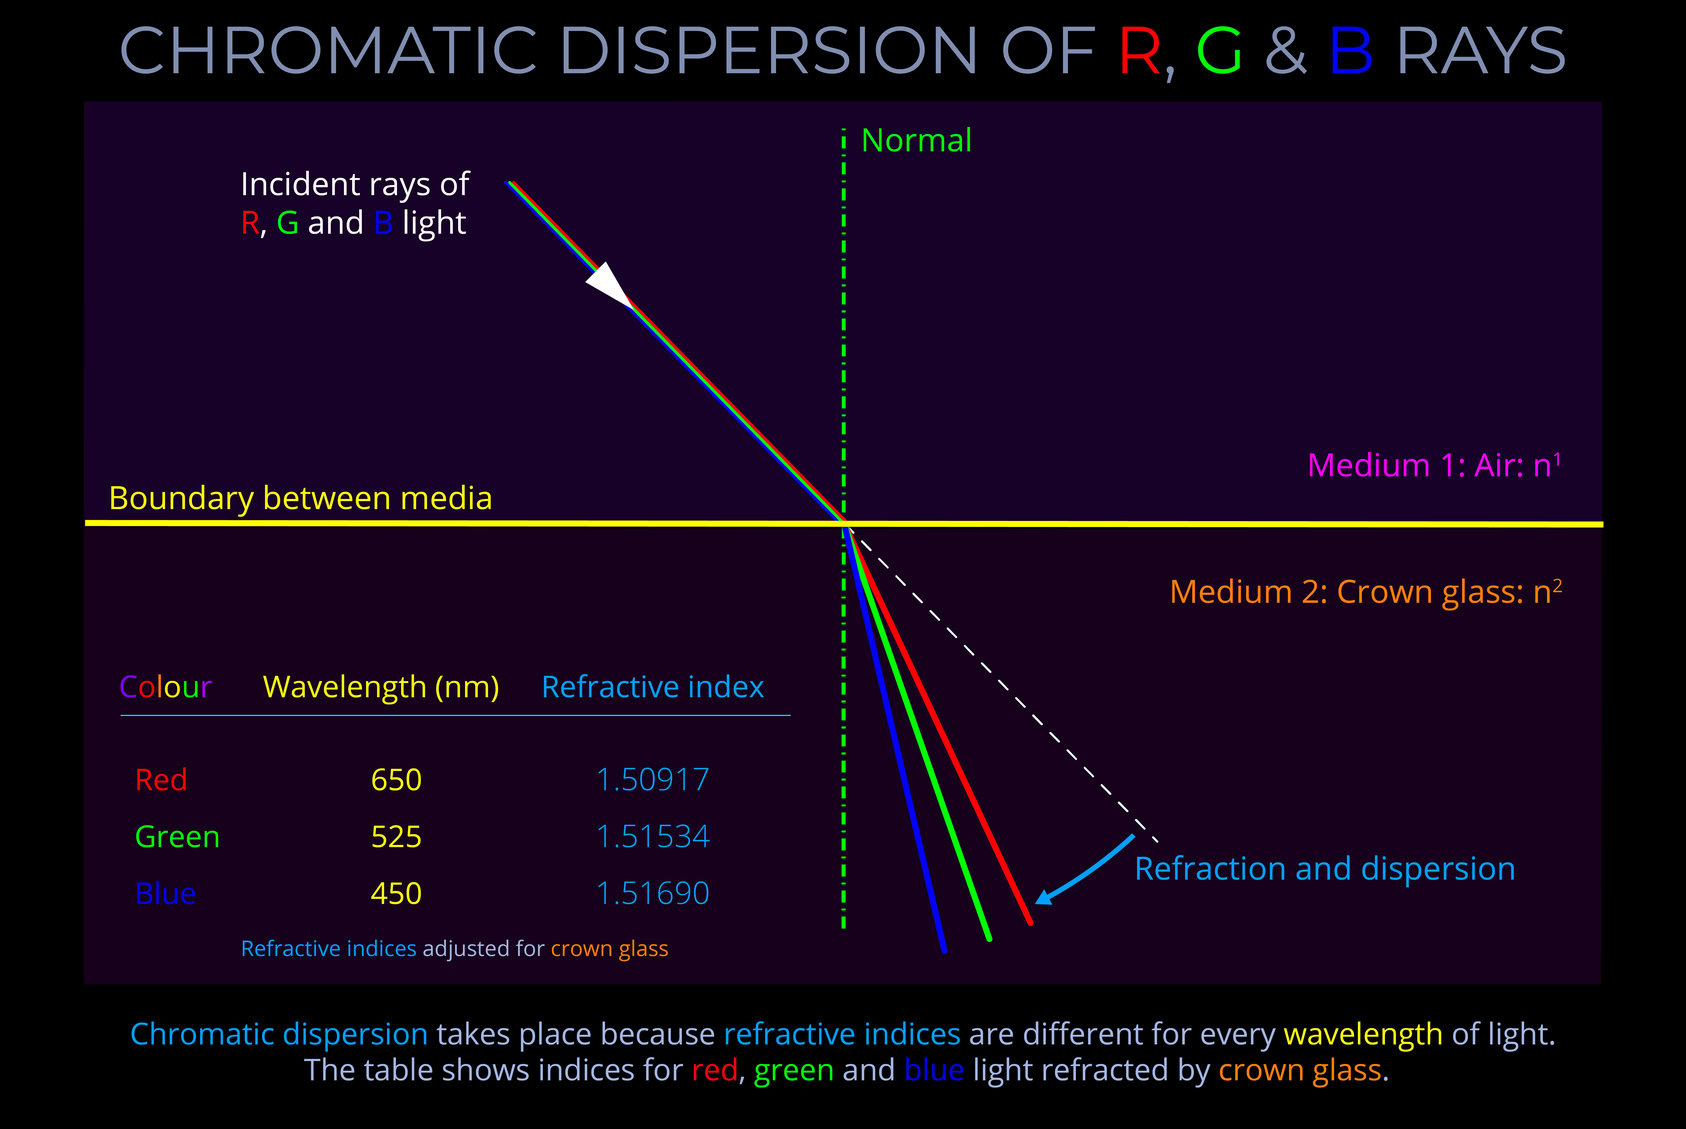
The diagram shows an incident ray of white light composed of wavelengths corresponding with red, green and blue wavelengths approaching the boundary between air and glass.
- As the ray crosses the boundary into the glass each wavelength bends towards the normal (the dotted green line) by a different amount.
- The incident ray of light is refracted towards the normal because the ray travels from air, the faster, less optically dense medium with a smaller refractive index into the glass, a slower, more optically dense medium with the higher refractive index.
Description
Chromatic Dispersion of R, G & B Rays
TRY SOME QUICK QUESTIONS AND ANSWERS TO GET STARTED
About the diagram
Have you already checked out An Introduction to Reflection, Refraction and Dispersion?
It is the opening page of our Reflection, Refraction and Dispersion Series and contains masses of useful information. This is the table of contents:
Overview of this page
- This page looks at the refraction and chromatic dispersion of a ray of white light at the boundary between air and glass.
- Related topics including reflection are covered on other pages of this series.
- Introductions to the terms refractive index and the law of refraction (sometimes called Snell’s law) also appear on later pages in the series.
An overview of refraction
- Refraction refers to the way that light (electromagnetic radiation) changes speed and direction as it travels from one transparent medium into another.
- Refraction takes place as light travels across the boundary between different transparent media and is a result of their different optical properties.
- Refraction is the result of the differences in the optical density of transparent media. Gases have a very low optical density whilst diamonds have a high optical density.
- When light is refracted its path bends and so changes direction.
- The effect of refraction on the path of a ray of light is measured by the difference between the angle of incidence and the angle of reflection.
- As light travels across the interface between different media it changes speed.
- Depending on the media through which light is refracted, its speed can either increase or decrease.
An overview of chromatic dispersion
- The term chromatic dispersion (often simply called dispersion) refers to the way that different wavelengths of light separate at the boundary between transparent media during the process of refraction.
- Dispersion causes the separate wavelengths present in a ray of light to fan out so that their corresponding colours become visible to an observer.
- When white light is dispersed, the spread of colours has red on one side and violet at the other.
- The colours produced by dispersion are spectral colours – ROYGBV.
- Dispersion occurs because refraction causes every wavelength of light to alter speed, and at the same time, to bend and change direction by a different amount.
- For dispersion to occur the incident light approaching the boundary between two different transparent media must contain a sufficiently wide range of wavelengths to enable them to separate out so that their associated colours are visible to an observer.
An overview of refraction and wavelength
- Every wavelength of light is affected to a different degree when it encounters a medium and undergoes refraction.
- Every wavelength of light changes both speed and direction by a different amount when it encounters a medium and undergoes refraction.
- The change in angle for any wavelength of light undergoing refraction within a specific transparent medium can be predicted if the refractive index of the medium is known.
- The refractive index for a medium is calculated by finding the difference between the speed of light in a vacuum and its speed as it travels through the medium.
- To understand dispersion we must recognise that the refractive index of a transparent medium must be corrected for different wavelengths of the visible spectrum.
The diagram
The diagram shows an incident ray of light composed of wavelengths corresponding with red, green and blue approaching the boundary between air and glass.
- As the ray crosses the boundary into the glass it bends towards the normal (the dotted green line).
- Refraction is towards the normal because the ray travels from air, the faster, less optically dense medium with a smaller refractive index into the glass, a slower, more optically dense medium with a higher refractive index.
- Refraction results in the dispersion of the wavelengths present in the incident ray.
- The table shows the wavelengths and refractive indices for red, green and blue when refracted by crown glass.
The effect shown in the diagram is similar to when white light strikes a prism and a rainbow of colours become visible to an observer.
- As light enters a prism it separates into its component wavelengths which an observer perceives as bands of colour.
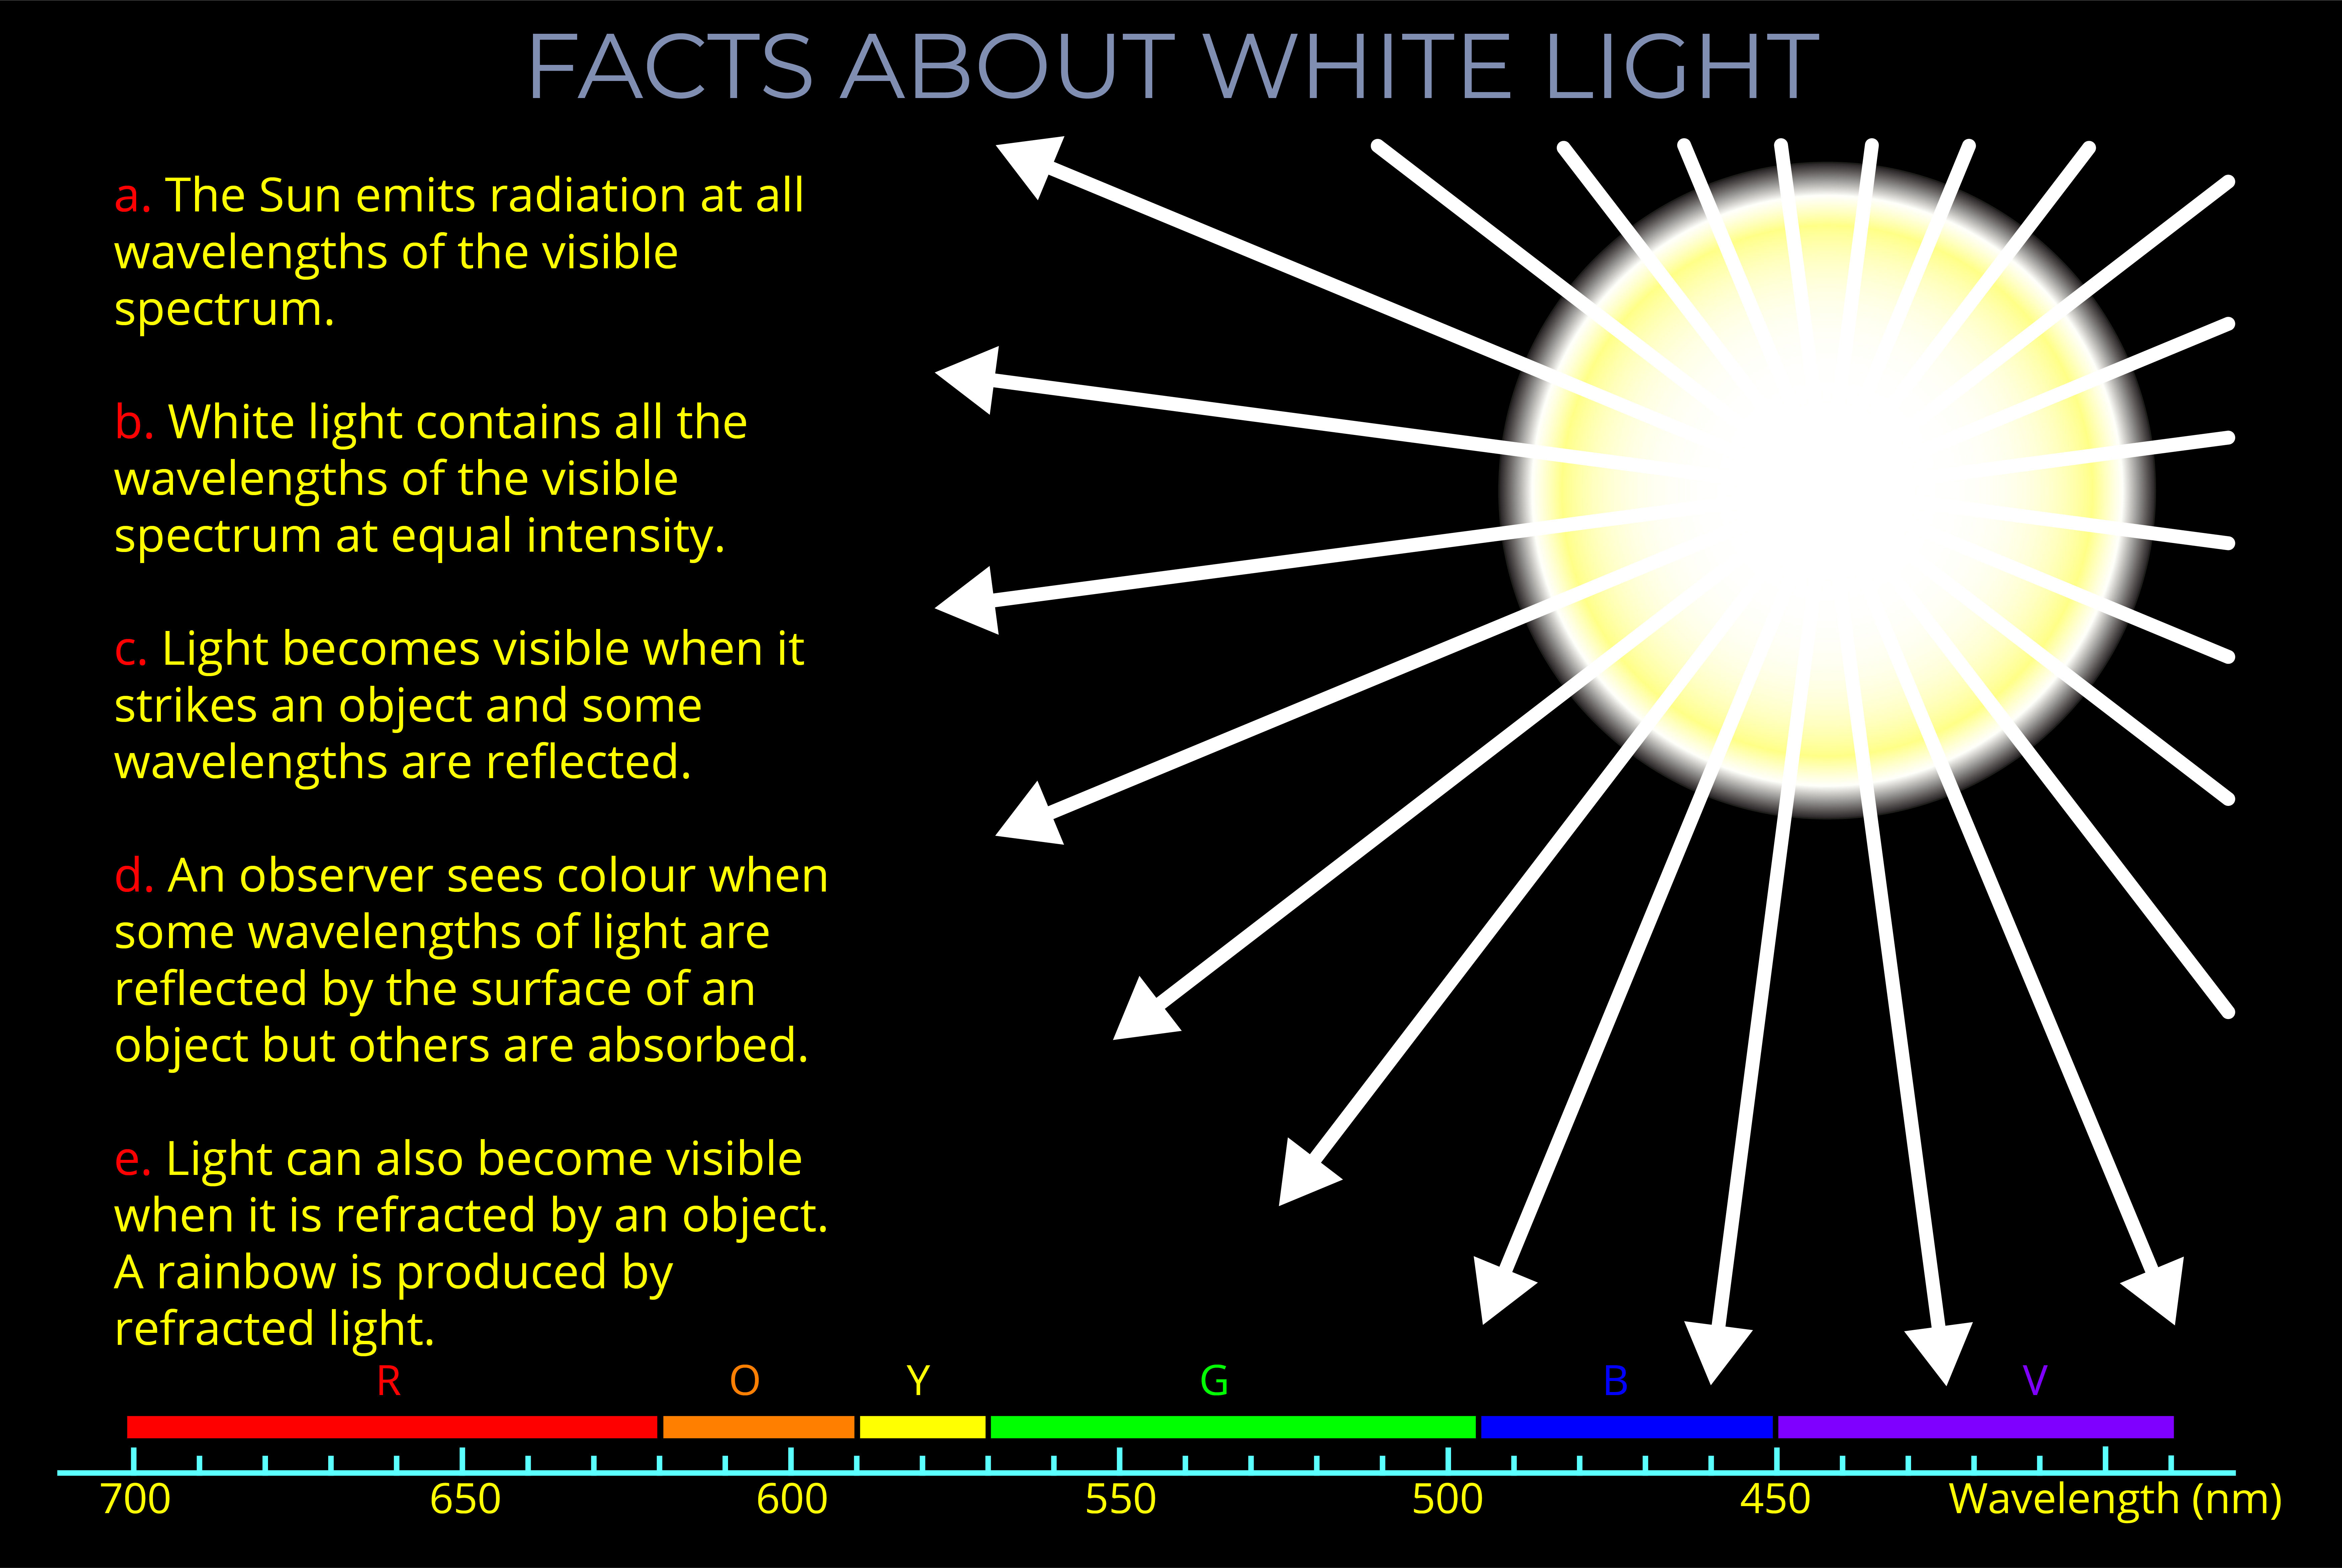
- Colour is not a property of electromagnetic radiation, but a feature of visual perception experienced by an observer in the presence of light.
Remember:
- All transparent media cause incident light to change direction and to disperse into their component colours.
- When light is refracted and changes direction, the angle is determined by the refractive index of the medium it enters.
- Refractive index (n) is equal to the speed of light in a vacuum (c) divided by the speed of light in the medium (v)
- Light travels at 299.792 kilometres per second in a vacuum.
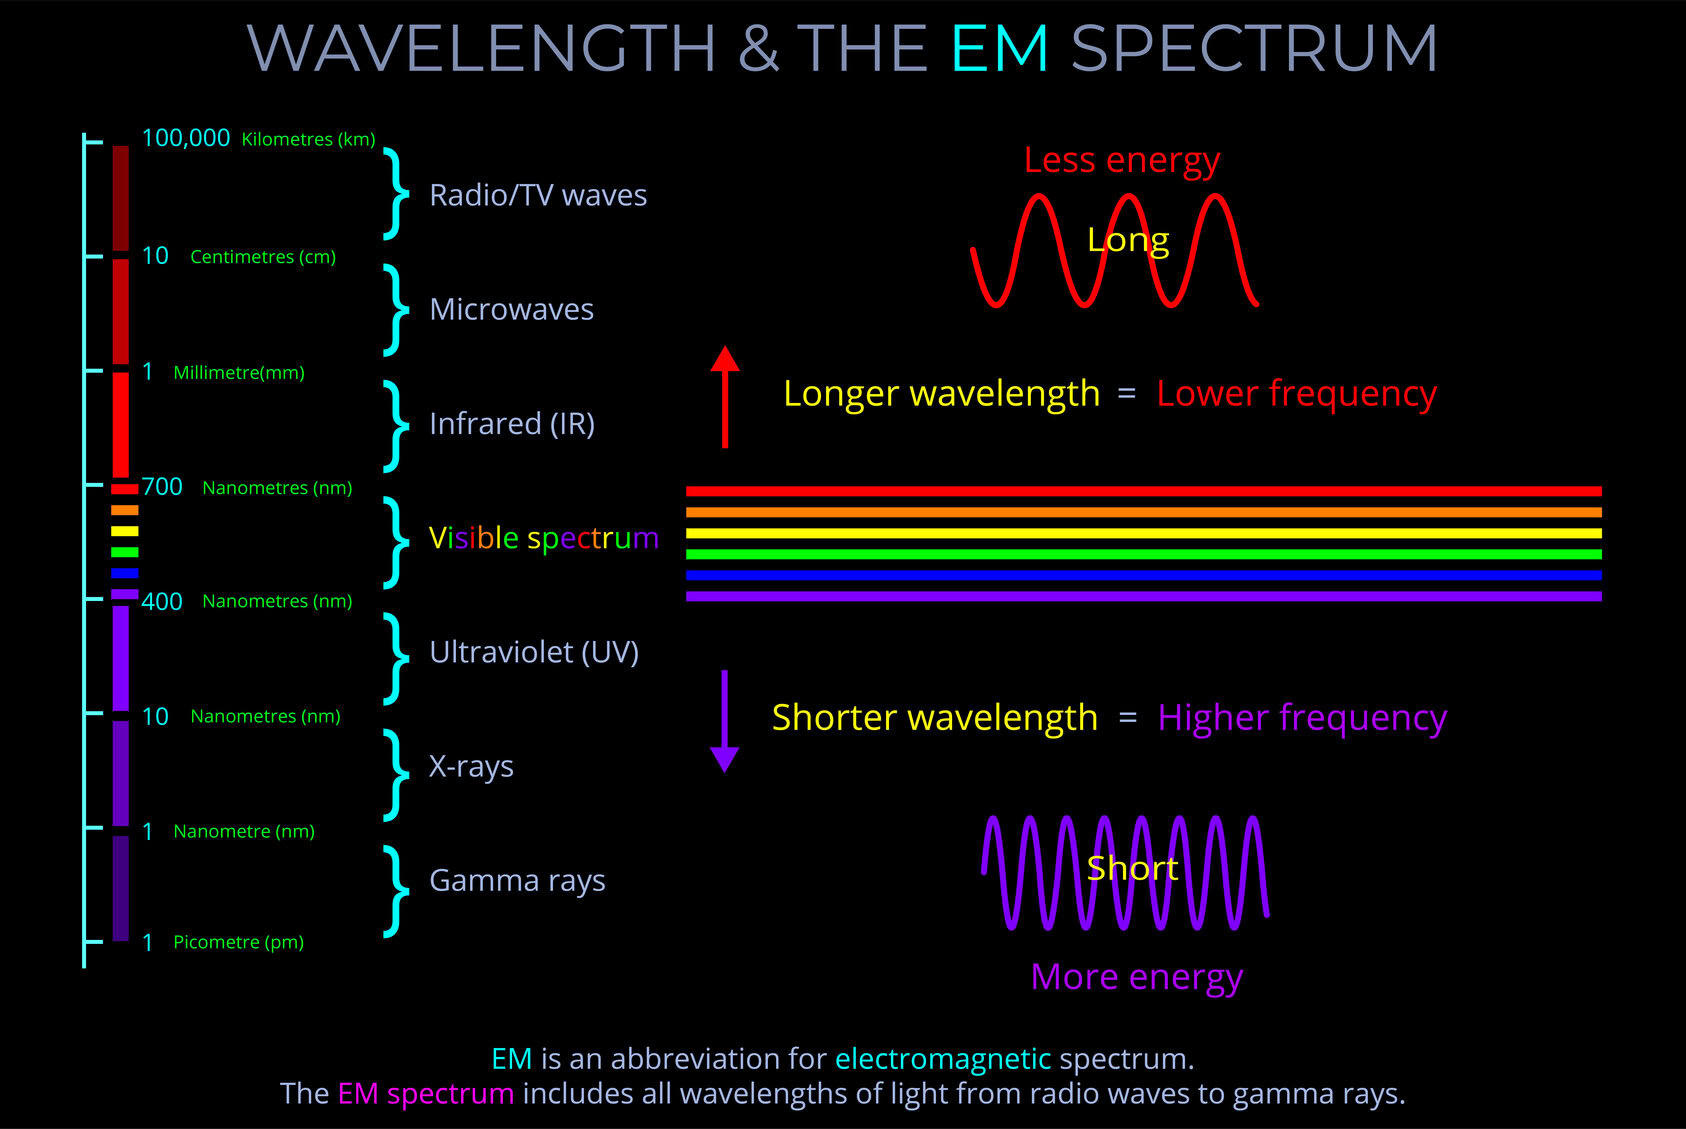
- Only a narrow range of wavelengths that form the full electromagnetic spectrum are visible to the human eye.
- The wavelengths that we can see are known as the visible spectrum.
- The presence of different wavelengths of light around us results in the colours we see in the world around us.
For an explanation of the refractive index (index of refraction) of a medium see: Refractive Index Explained.
For an explanation of how to use the refractive index of a medium see: How to Use the Refractive Index of a Medium.
For an explanation of the Law of Refraction see: Snell’s Law of Refraction Explained.
Some key terms
If one line is normal to another, then it is at right angles to it.
In geometry, normal (a or the normal) refers to a line drawn perpendicular to a given line, plane or surface.
- How the normal appears in a geometric drawing depends on the circumstances:
- When light strikes a flat surface or plane, or the boundary between two surfaces, the normal is drawn perpendicular to the surface, forming a right angle (90°) with it.
- Expressed more formally, in optics, the normal is a geometric construct, a line drawn perpendicular to the interface between two media at the point of contact. This conceptually defined reference line is crucial for characterizing various light-matter interactions, such as reflection, refraction, and absorption.
- When dealing with curved surfaces, such as those found on spheres or other three-dimensional objects, determining the normal requires a slightly different approach. Instead of simply drawing a line perpendicular to the surface as with a flat plane, draw the normal straight up from the point where light hits the surface.
- When considering a sphere, the normal line passes through the centre of the sphere. This is because, regardless of where light enters or exits the sphere, the normal represents the direction perpendicular to the surface at that point.
In physics and optics, a medium refers to any material through which light or other electromagnetic waves can travel. It’s essentially a substance that acts as a carrier for these waves.
- Light is a form of electromagnetic radiation, which travels in the form of waves. These waves consist of oscillating electric and magnetic fields.
- The properties of the medium, such as its density and composition, influence how light propagates through it.
- Different mediums can affect the speed, direction, and behaviour of light waves. For instance, light travels slower in water compared to a vacuum.
- Examples of Mediums:
- Transparent: Materials like air, glass, and water allow most light to pass through, with minimal absorption or scattering. These are good examples of mediums for light propagation.
- Translucent: Some materials, like frosted glass or thin paper, partially transmit light. They allow some light to pass through while diffusing or scattering the rest.
- Opaque: Materials like wood or metal block light completely. They don’t allow any light to travel through them.
As light crosses the boundary between two transparent media, the law of refraction (Snell’s law) states the relationship between the angle of incidence and angle of refraction of the light with reference to the refractive indices of both media as follows:
When electromagnetic radiation (light) of a specific frequency crosses the interface of any given pair of media, the ratio of the sines of the angles of incidence and the sines of the angles of refraction is a constant in every case.
- Snell’s law deals with the fact that for an incident ray approaching the boundary of two media, the sine of the angle of incidence multiplied by the index of refraction of the first medium is equal to the sine of the angle of refraction multiplied by the index of refraction of the second medium.
- Snell’s law deals with the fact that the sine of the angle of incidence to the sine of the angle of refraction is constant when a light ray passes across the boundary from one medium to another.
- Snell’s law can be used to calculate the angle of incidence or refraction associated with the use of lenses, prisms and other everyday materials.
- When using Snell’s law:
- The angles of incidence and refraction are measured between the direction of a ray of light and the normal – where the normal is an imaginary line drawn on a ray diagram perpendicular to, so at a right angle to (900), to the boundary between two media.
- The wavelength of the incident light is accounted for.
- The refractive indices used are selected for the pair of media concerned.
- The speed of light is expressed in metres per second (m/s).
A wave diagram is a graphic representation, using specific drawing rules and labels, that depicts variations in the characteristics of light waves. These characteristics include changes in wavelength, frequency, amplitude, speed of light and propagation direction.
- A wave diagram provides a visual representation of how a wave behaves when interacting with various media or objects.
- The purpose of a wave diagram is to illustrate optical phenomena, including reflection, refraction, dispersion, and diffraction.
- Wave diagrams can be useful in both theoretical and practical applications, such as understanding the basics of the physics of light or when designing complex optical systems.
The refractive index (index of refraction) of a medium measures how much the speed of light is reduced when it passes through a medium compared to its speed in a vacuum.
- Refractive index (or, index of refraction) is a measurement of how much the speed of light is reduced when it passes through a medium compared to the speed of light in a vacuum.
- The concept of refractive index applies to the full electromagnetic spectrum, from gamma-rays to radio waves.
- The refractive index can vary with the wavelength of the light being refracted. This phenomenon is called dispersion, and it is what causes white light to split into its constituent colours when it passes through a prism.
- The refractive index of a material can be affected by various factors such as temperature, pressure, and density.
Incident light refers to light that is travelling towards an object or medium.
- Incident light refers to light that is travelling towards an object or medium.
- Incident light may come from the Sun, an artificial source or may have already been reflected off another surface, such as a mirror.
- When incident light strikes a surface or object, it may be absorbed, reflected, refracted, transmitted or undergo any combination of these optical effects.
- Incident light is typically represented on a ray diagram as a straight line with an arrow to indicate its direction of propagation.
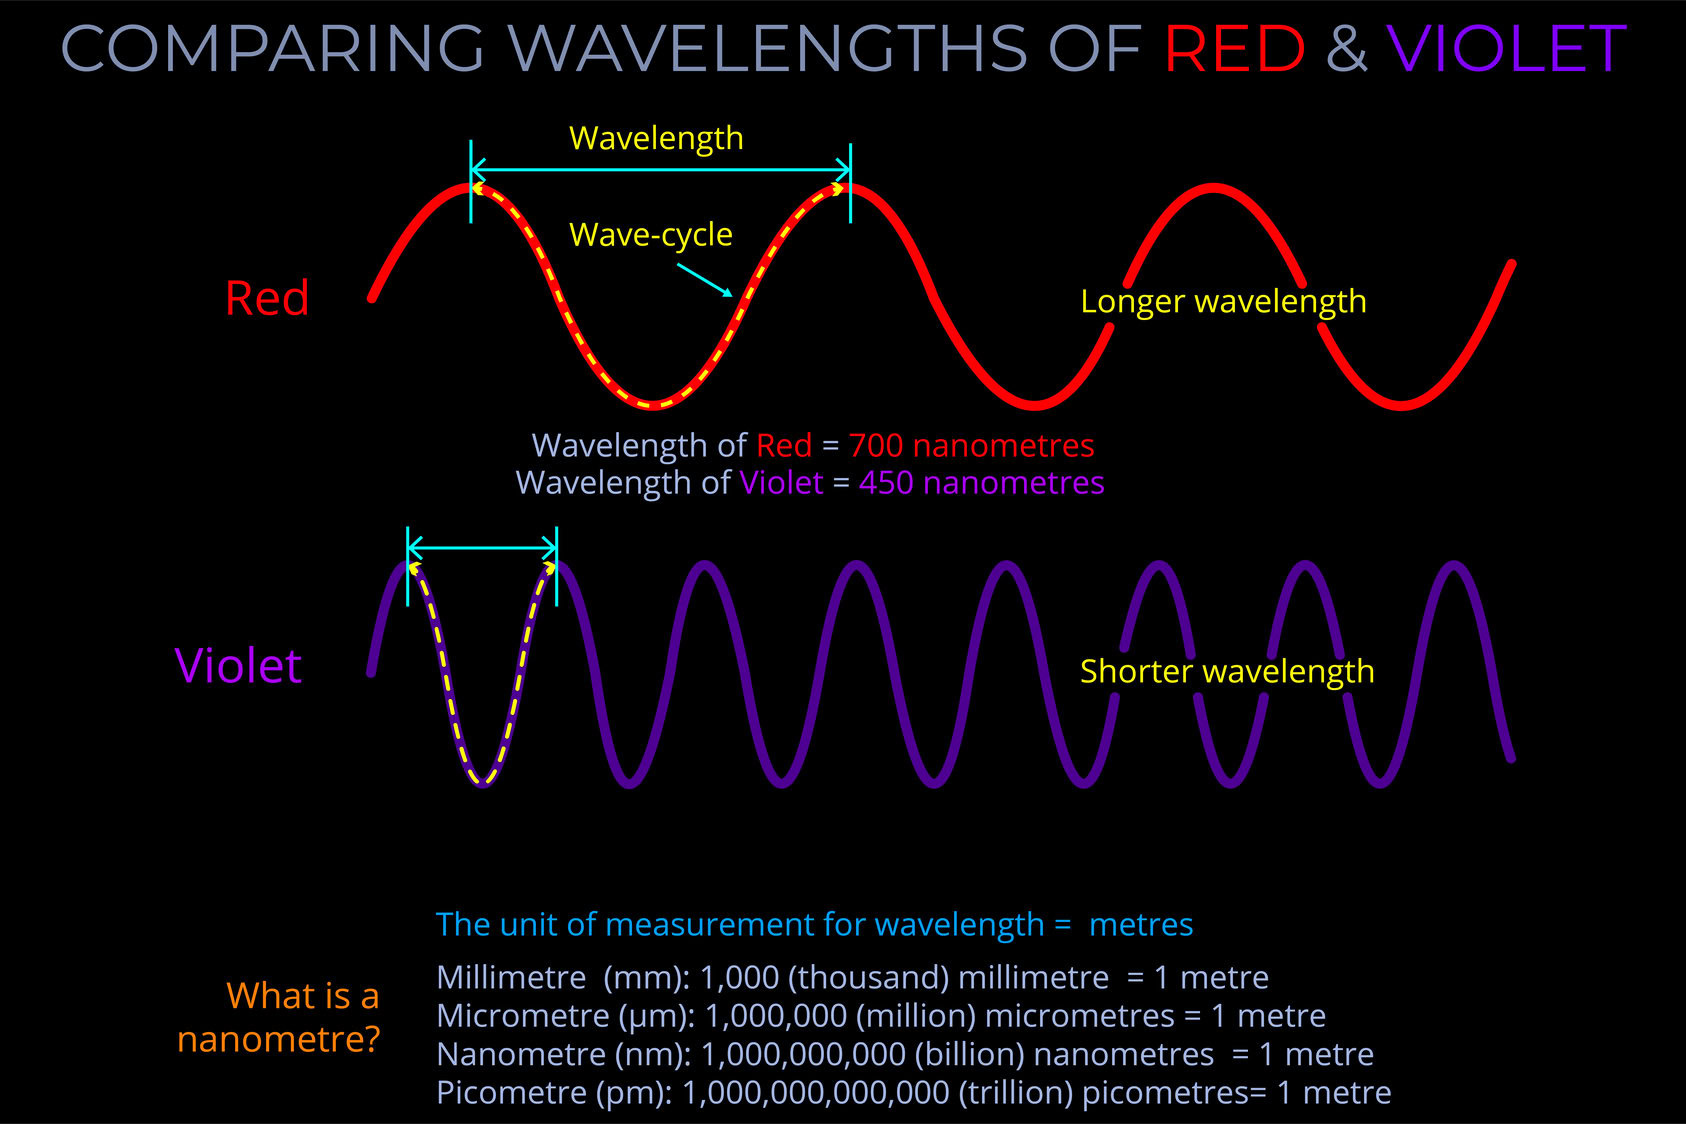
Wavelength measures a complete wave cycle, which is the distance from any point on a wave to the corresponding point on the next wave.
- While wavelength can be measured from any point on a wave, it is often simplest to measure from the peak of one wave to the peak of the next or from the bottom of one trough to the bottom of the next, ensuring the measurement covers the whole of the cycle.
- The wavelength of an electromagnetic wave is usually given in metres.
- The wavelength of visible light is typically measured in nanometres, with 1,000,000,000 nanometres making up a metre.
- Radio waves, visible light, and gamma waves for example, each have different ranges of wavelengths within the electromagnetic spectrum.
In the field of optics, dispersion is shorthand for chromatic dispersion which refers to the way that light, under certain conditions, separates into its component wavelengths, enabling the colours corresponding with each wavelength to become visible to a human observer.
- Chromatic dispersion refers to the dispersion of light according to its wavelength or colour.
- Chromatic dispersion is the result of the relationship between wavelength and refractive index.
- When light travels from one medium (such as air) to another (such as glass or water) each wavelength is refracted differently, causing the separation of white light into its constituent colours.
- When light undergoes refraction each wavelength changes direction by a different amount. In the case of white light, the separate wavelengths fan out into distinct bands of colour with red on one side and violet on the other.
- Familiar examples of chromatic dispersion are when white light strikes a prism or raindrops and a rainbow of colours becomes visible to an observer.
The refractive index (index of refraction) of a medium measures how much the speed of light is reduced when it passes through a medium compared to its speed in a vacuum.
- Refractive index (or, index of refraction) is a measurement of how much the speed of light is reduced when it passes through a medium compared to the speed of light in a vacuum.
- The concept of refractive index applies to the full electromagnetic spectrum, from gamma-rays to radio waves.
- The refractive index can vary with the wavelength of the light being refracted. This phenomenon is called dispersion, and it is what causes white light to split into its constituent colours when it passes through a prism.
- The refractive index of a material can be affected by various factors such as temperature, pressure, and density.
Refraction refers to the way that electromagnetic radiation (light) changes speed and direction as it travels across the boundary between one transparent medium and another.
- Light bends towards the normal and slows down when it moves from a fast medium (like air) to a slower medium (like water).
- Light bends away from the normal and speeds up when it moves from a slow medium (like diamond) to a faster medium (like glass).
- These phenomena are governed by Snell’s law, which describes the relationship between the angles of incidence and refraction.
- The refractive index (index of refraction) of a medium indicates how much the speed and direction of light are altered when travelling in or out of a medium.
- It is calculated by dividing the speed of light in a vacuum by the speed of light in the material.
- Snell’s law relates the angles of incidence and refraction to the refractive indices of the two media involved.
- Snell’s law states that the ratio of the sine of the angle of incidence to the sine of the angle of refraction is equal to the ratio of the refractive indices.
Diagrams are free to download
Related products
-

Wavelength & the EM Spectrum
£0.00 Select options This product has multiple variants. The options may be chosen on the product page -
Facts about White Light
£0.00 Select options This product has multiple variants. The options may be chosen on the product page -

Comparing Wavelengths of Red & Violet
£0.00 Select options This product has multiple variants. The options may be chosen on the product page