Refraction Towards the Normal
£0.00
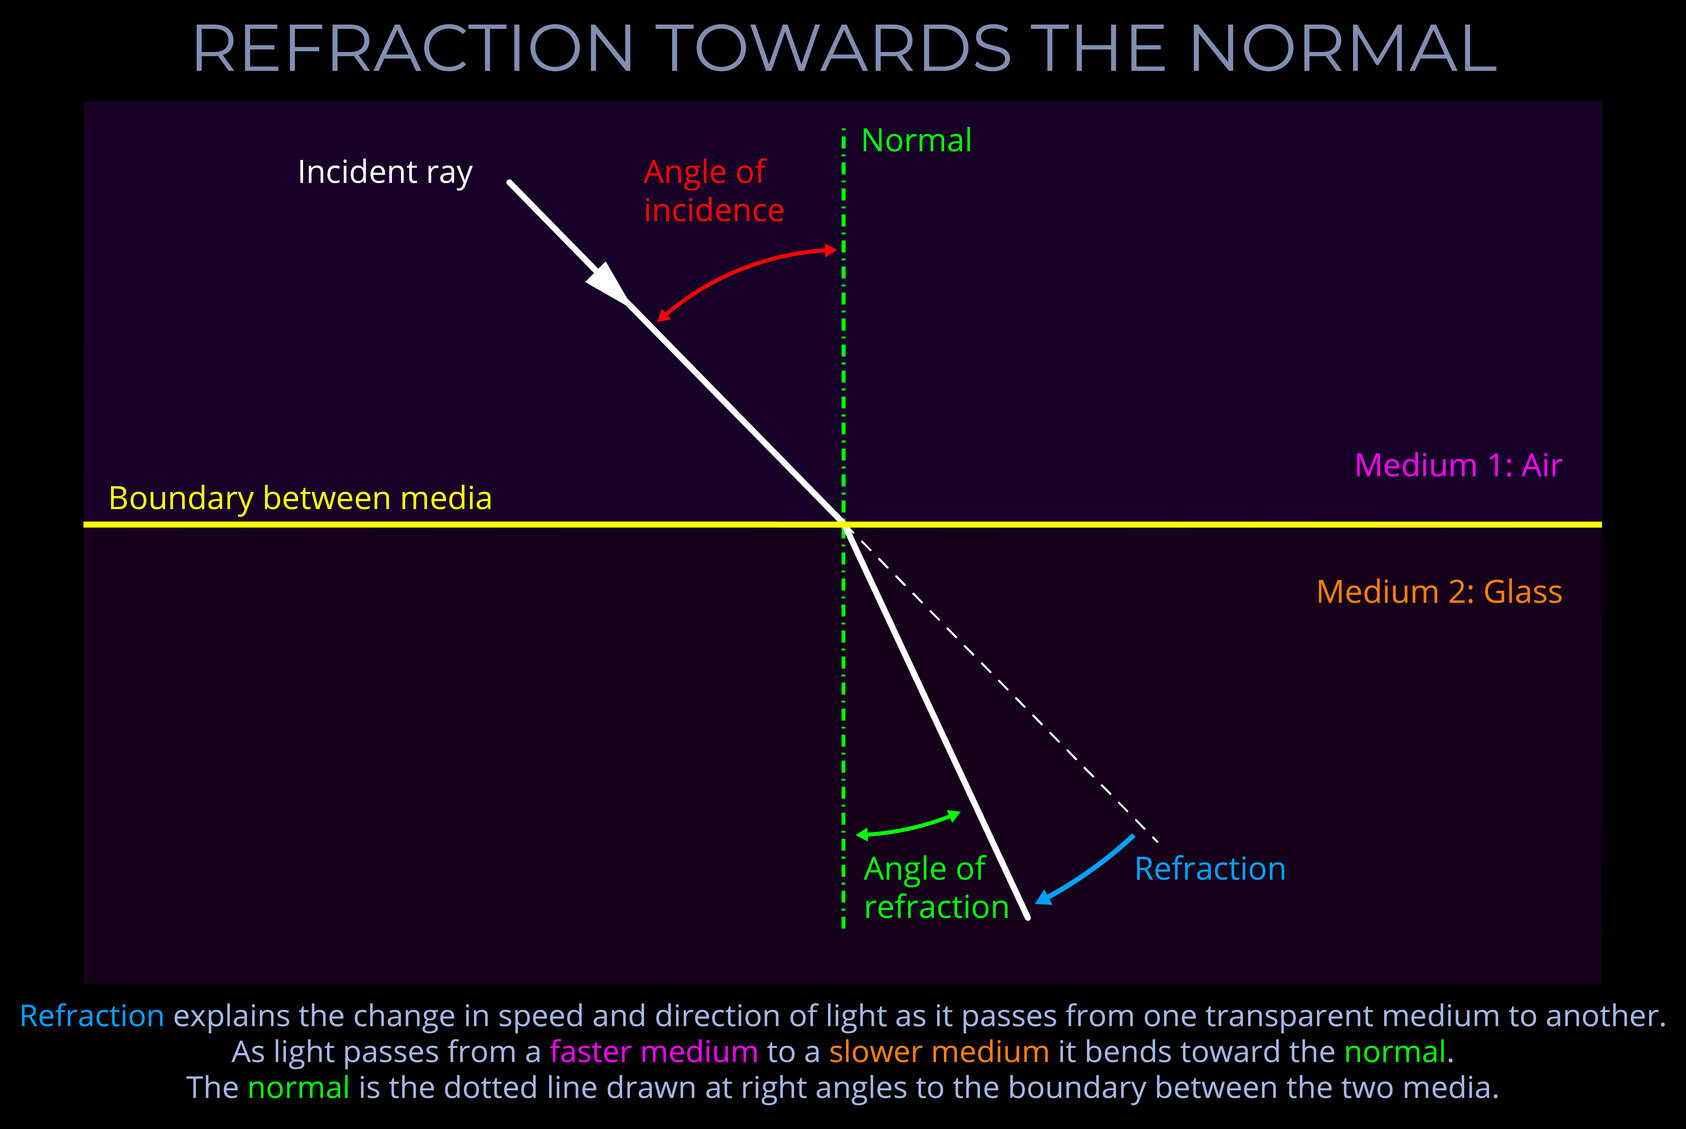
The diagram shows an incident ray of white light approaching the boundary between air and glass.
- As the ray crosses the boundary and encounters the glass it bends towards the normal (the dotted green line).
- The incident ray of light is refracted towards the normal because the ray travels from air, the faster, less optically dense medium with a lower refractive index into the glass, a slower, more optically dense medium with the higher refractive index.
Description
Refraction Towards the Normal
TRY SOME QUICK QUESTIONS AND ANSWERS TO GET STARTED
About the diagram
Have you already checked out An Introduction to Reflection, Refraction and Dispersion?
It is the opening page of our Reflection, Refraction and Dispersion Series and contains masses of useful information. This is the table of contents:
Overview of this page
- This page provides an introduction to refraction.
- It looks at the path of white light rather than at the paths of the different wavelengths that white light contains.
- Related topics including reflection and dispersion are covered on other pages of this series.
- Introductions to the terms refractive index and the law of refraction (sometimes called Snell’s law) also appear on later pages in the series.
An overview of refraction
- Refraction refers to the way that light (electromagnetic radiation) changes direction and speed as it travels from one transparent medium into another.
- Refraction takes place as light travels across the boundary between different transparent media and is a result of their different optical properties.
- When light is refracted its path bends and so changes direction.
- The effect of refraction on the path of a ray of light is measured by the difference between the angle of incidence and the angle of reflection.
- As light travels across the interface between different media (such as between air and glass) it changes speed.
- Depending on the media through which light is refracted, its speed can increase or decrease.
About the diagram
- This diagram shows an incident ray of white light approaching the boundary between air and glass.
- The diagram shows that the angle of incidence and the angle of refraction of the ray of light are different as a result of refraction.
- As the ray crosses the boundary from the air and encounters the glass, it bends towards the normal (the dotted green line) because glass is an optically denser medium (with a higher refractive index than air) that slows it down.
- Imagine running into the wind. It’s always harder to run in water because it is a physically denser medium than air. The physical density of a substance is similar to the optical density of a transparent medium.
Refraction
- When light crosses the boundary between two different transparent media it undergoes refraction.
- The effect of refraction is that light changes speed along with its direction of travel.
- As the speed of light changes so does its wavelength but the frequency and so the colour an observer sees remains the same.
- The result of the change in direction is that rays either bend towards or away from the normal.
- The normal is an imaginary line drawn on a ray diagram at right angles (perpendicular) to the boundary between two media.
- The change between the angle of incidence and the angle of refraction of a ray of light is always measured between the ray and the normal.
- Whether light bends towards or away from the normal depends on the difference in optical density of the new medium it encounters.
- An incident ray of light is refracted towards the normal and slows down when it travels from air into glass. Compared with air, glass is a slower, more optically dense medium (with the higher refractive index).
- An incident ray of light is refracted away from the normal and speeds up when it travels from glass into air. Compared with glass, air is a faster, less optically dense medium (with a lower refractive index).
Calculating the angle of refraction
- The direction in which a ray bends, and the precise angle, can be calculated if the type and refractive indices of both media are known.
- The effect of refraction can be calculated using a neat little equation called the law of refraction (also known as Snell’s law).
- If three of the variables are known, the law of refraction can be used to calculate the fourth.
- Tables of refractive indices are available for common materials so that the change in direction of a ray can be calculated.
- Tables of refractive indices for common materials often provide both the refractive index for white light as well as indices for specific wavelengths.
For an explanation of the refractive index (index of refraction) of a medium see: Refractive Index Explained.
For an explanation of how to use the refractive index of a medium see: How to Use the Refractive Index of a Medium.
For an explanation of the Law of Refraction see: Snell’s Law of Refraction Explained.
Incident light
- Incident light refers to incoming light that is travelling towards an object or medium.
White light
- White light is the name given to visible light that contains all wavelengths of the visible spectrum at equal intensities.
- The sun emits white light because sunlight contains equal amounts of all of the wavelengths of the visible spectrum.
- As light travels through a vacuum or a medium it is described as white light if it contains all the wavelengths of visible light.
- As light travels through a vacuum or the air it is invisible to our eyes.
- White light is what an observer sees when all the colours that make up the visible spectrum strike a white or neutral coloured surface.
Visible spectrum
- The visible spectrum is the range of wavelengths of the electromagnetic spectrum that correspond with all the different colours we see in the world.
- Human beings don’t see wavelengths of visible light, but they do see the spectral colours that correspond with each wavelength and colours produced when different wavelengths are combined.
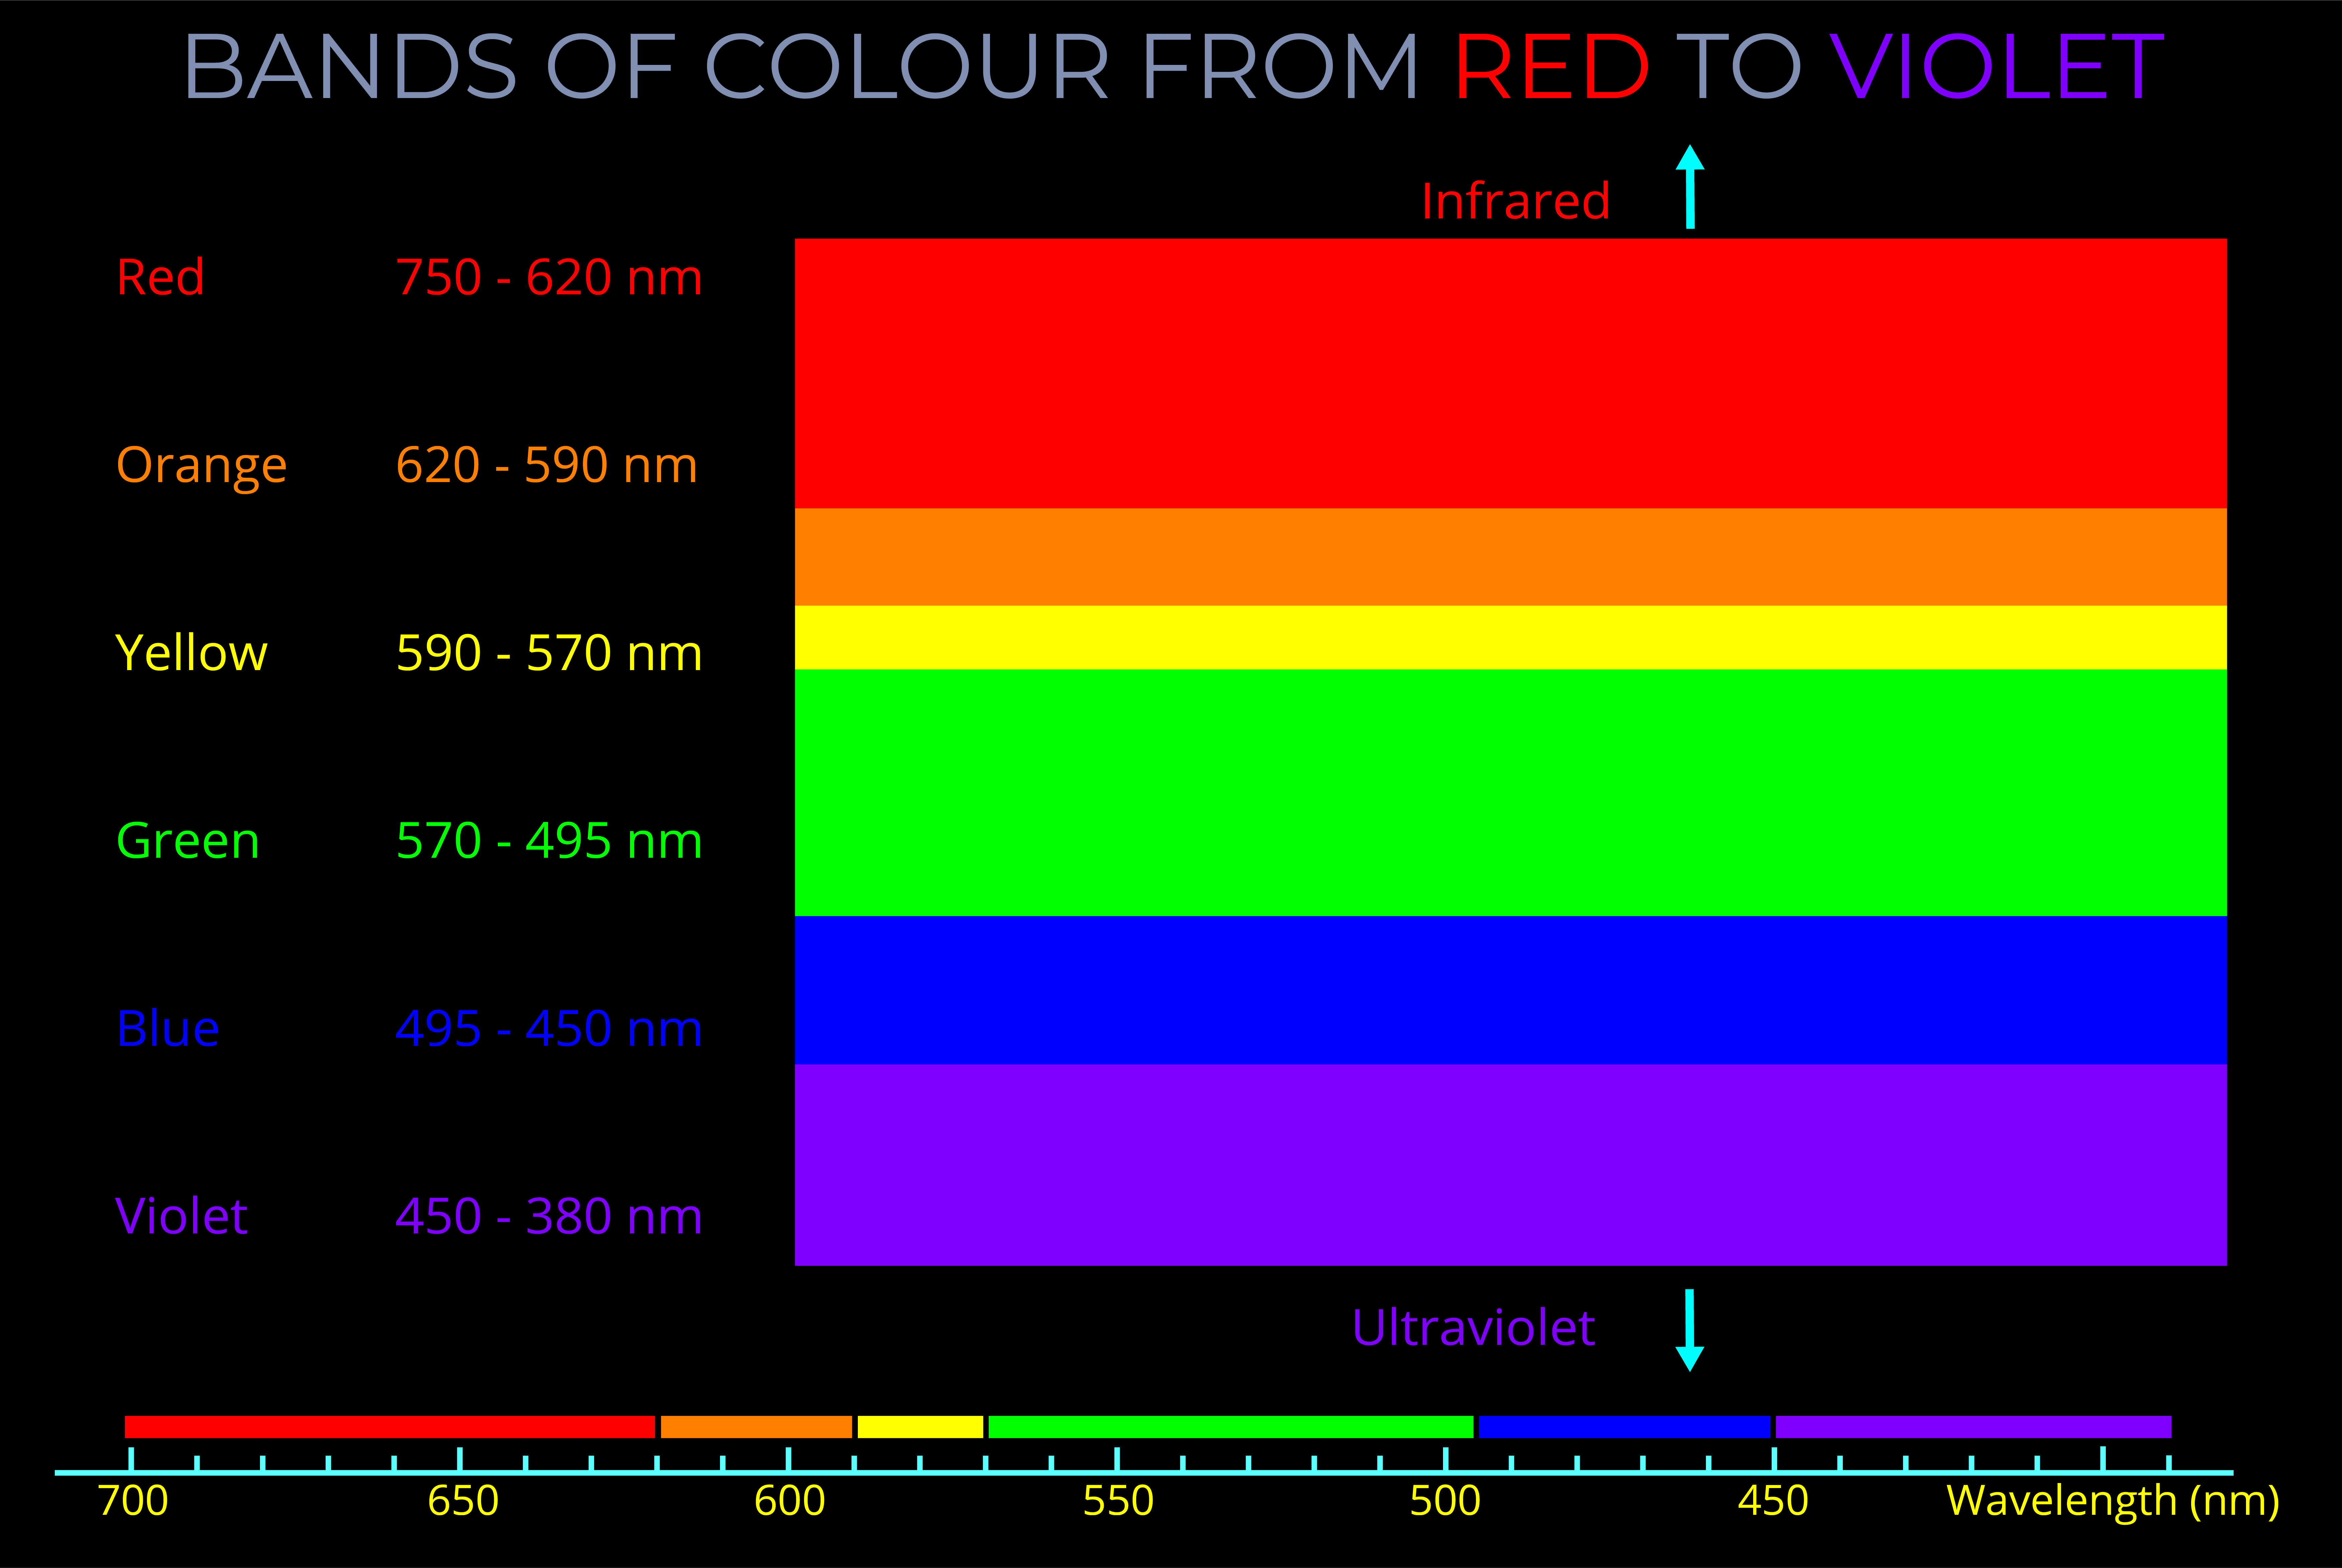
- The visible spectrum includes all the spectral colours between red and violet and each is produced by a single wavelength.
Angle of incidence
- The angle of incidence measures the angle at which incoming light strikes a surface.
- The angle of incidence is measured between a ray of incoming light and an imaginary line called the normal.
Angle of refraction
- The angle of refraction measures the angle to which light bends as it passes across the boundary between different media.
- The angle of refraction is measured between a ray of light and an imaginary line called the normal.
Optical density
- Optical density is a measurement of the degree to which a medium slows the transmission of light.
- The more optically dense a material, the slower light travels.
- The less optically dense a material, the faster light travels.
The normal
- In geometry, the normal is a line that intersects another line.
- In optics, the normal is an imaginary line drawn on a ray diagram at right angles (perpendicular) to the boundary between two media.
- The normal is often used to measure angles against.
Some key terms
Wavelength measures a complete wave cycle, which is the distance from any point on a wave to the corresponding point on the next wave.
- While wavelength can be measured from any point on a wave, it is often simplest to measure from the peak of one wave to the peak of the next or from the bottom of one trough to the bottom of the next, ensuring the measurement covers the whole of the cycle.
- The wavelength of an electromagnetic wave is usually given in metres.
- The wavelength of visible light is typically measured in nanometres, with 1,000,000,000 nanometres making up a metre.
- Radio waves, visible light, and gamma waves for example, each have different ranges of wavelengths within the electromagnetic spectrum.
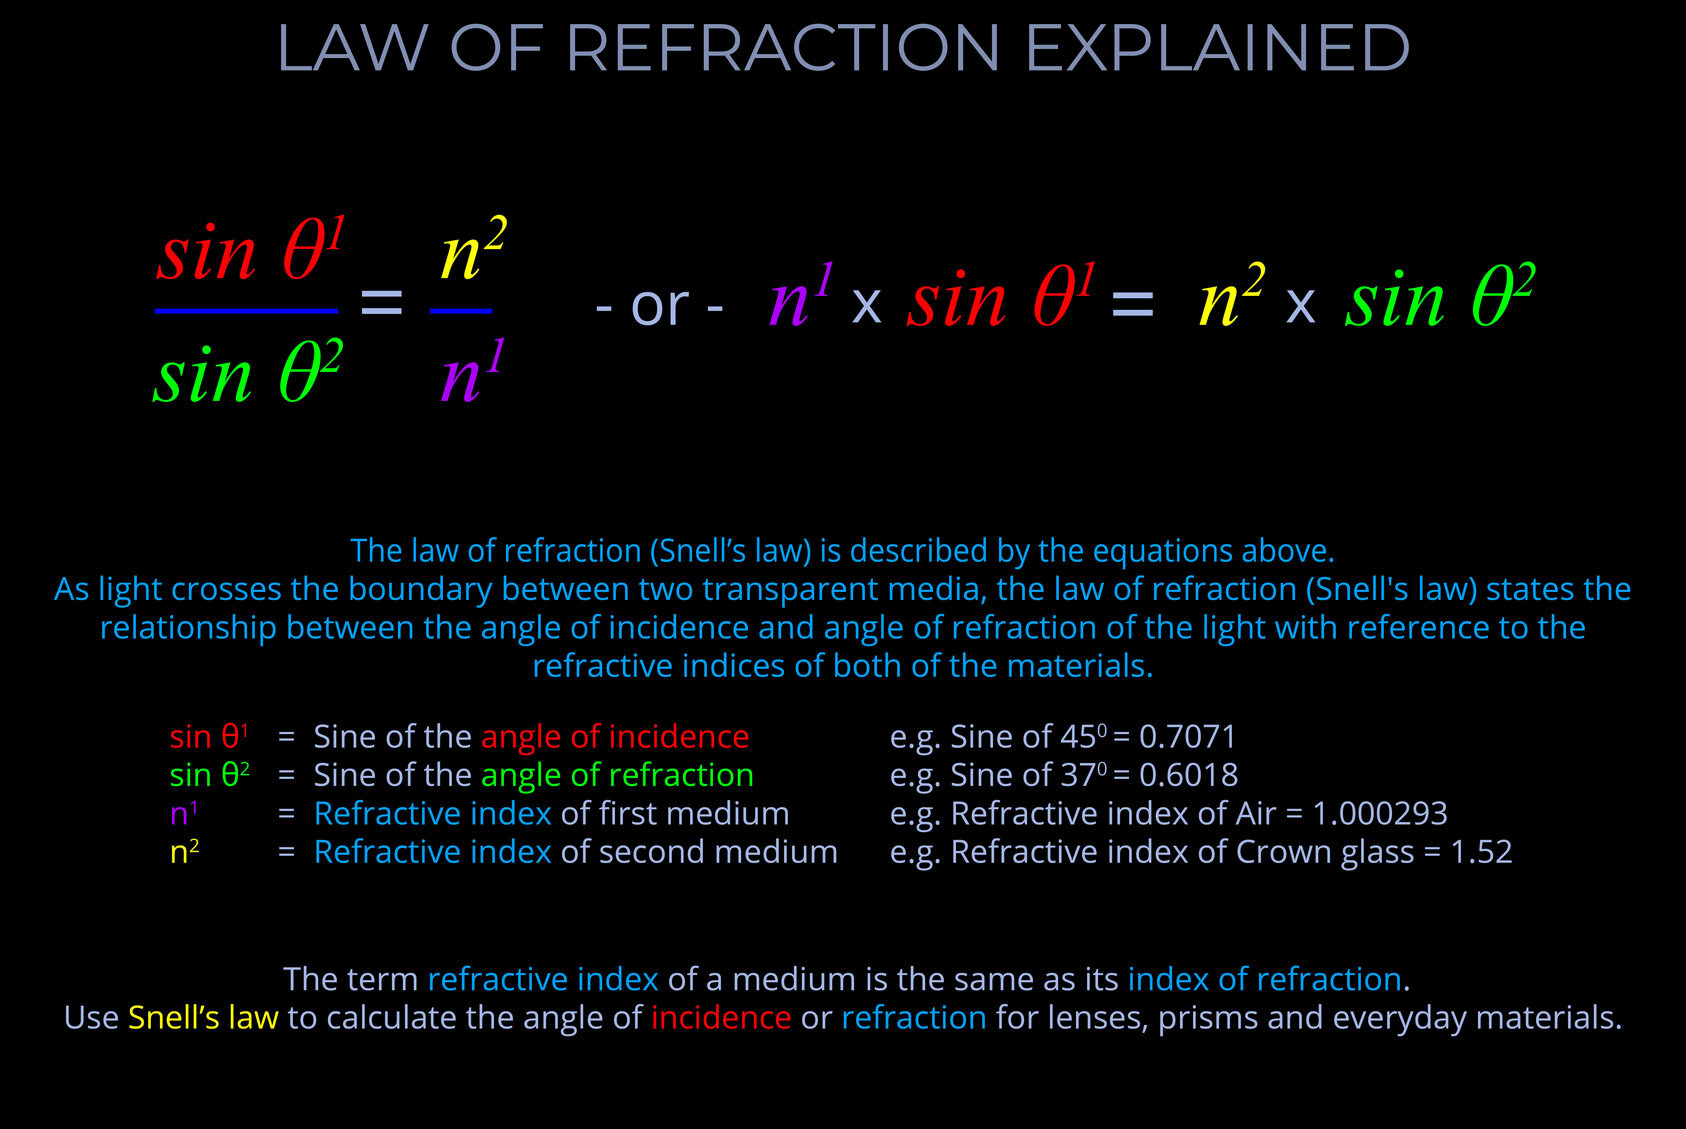
As light crosses the boundary between two transparent media, the law of refraction (Snell’s law) states the relationship between the angle of incidence and angle of refraction of the light with reference to the refractive indices of both media as follows:
When electromagnetic radiation (light) of a specific frequency crosses the interface of any given pair of media, the ratio of the sines of the angles of incidence and the sines of the angles of refraction is a constant in every case.
- Snell’s law deals with the fact that for an incident ray approaching the boundary of two media, the sine of the angle of incidence multiplied by the index of refraction of the first medium is equal to the sine of the angle of refraction multiplied by the index of refraction of the second medium.
- Snell’s law deals with the fact that the sine of the angle of incidence to the sine of the angle of refraction is constant when a light ray passes across the boundary from one medium to another.
- Snell’s law can be used to calculate the angle of incidence or refraction associated with the use of lenses, prisms and other everyday materials.
- When using Snell’s law:
- The angles of incidence and refraction are measured between the direction of a ray of light and the normal – where the normal is an imaginary line drawn on a ray diagram perpendicular to, so at a right angle to (900), to the boundary between two media.
- The wavelength of the incident light is accounted for.
- The refractive indices used are selected for the pair of media concerned.
- The speed of light is expressed in metres per second (m/s).
The refractive index (index of refraction) of a medium measures how much the speed of light is reduced when it passes through a medium compared to its speed in a vacuum.
- Refractive index (or, index of refraction) is a measurement of how much the speed of light is reduced when it passes through a medium compared to the speed of light in a vacuum.
- The concept of refractive index applies to the full electromagnetic spectrum, from gamma-rays to radio waves.
- The refractive index can vary with the wavelength of the light being refracted. This phenomenon is called dispersion, and it is what causes white light to split into its constituent colours when it passes through a prism.
- The refractive index of a material can be affected by various factors such as temperature, pressure, and density.
A wave is a disturbance that travels through a medium or space, transporting energy from one point to another. Waves can travel through a medium, like waves rippling across a lake, or through space, like the electromagnetic waves that carry sunlight to Earth.
- Electromagnetic waves are generally invisible to the human eye, the exception is the visible spectrum, with wavelengths between approximately 400 and 700 nanometres.
- Beyond this range, whether the wavelengths are longer (as in radio and microwaves) or shorter (as in ultraviolet, X-rays, and gamma rays), our eyes cannot detect them.
- Although we cannot see most electromagnetic waves, we can perceive some in other ways. For instance, infrared waves are felt as heat, and electric current (which produces electromagnetic waves) can cause a buzzing sensation in a wire or cause electrocution.
In physics and optics, a medium refers to any material through which light or other electromagnetic waves can travel. It’s essentially a substance that acts as a carrier for these waves.
- Light is a form of electromagnetic radiation, which travels in the form of waves. These waves consist of oscillating electric and magnetic fields.
- The properties of the medium, such as its density and composition, influence how light propagates through it.
- Different mediums can affect the speed, direction, and behaviour of light waves. For instance, light travels slower in water compared to a vacuum.
- Examples of Mediums:
- Transparent: Materials like air, glass, and water allow most light to pass through, with minimal absorption or scattering. These are good examples of mediums for light propagation.
- Translucent: Some materials, like frosted glass or thin paper, partially transmit light. They allow some light to pass through while diffusing or scattering the rest.
- Opaque: Materials like wood or metal block light completely. They don’t allow any light to travel through them.
The refractive index (index of refraction) of a medium measures how much the speed of light is reduced when it passes through a medium compared to its speed in a vacuum.
- Refractive index (or, index of refraction) is a measurement of how much the speed of light is reduced when it passes through a medium compared to the speed of light in a vacuum.
- The concept of refractive index applies to the full electromagnetic spectrum, from gamma-rays to radio waves.
- The refractive index can vary with the wavelength of the light being refracted. This phenomenon is called dispersion, and it is what causes white light to split into its constituent colours when it passes through a prism.
- The refractive index of a material can be affected by various factors such as temperature, pressure, and density.
A wave diagram is a graphic representation, using specific drawing rules and labels, that depicts variations in the characteristics of light waves. These characteristics include changes in wavelength, frequency, amplitude, speed of light and propagation direction.
- A wave diagram provides a visual representation of how a wave behaves when interacting with various media or objects.
- The purpose of a wave diagram is to illustrate optical phenomena, including reflection, refraction, dispersion, and diffraction.
- Wave diagrams can be useful in both theoretical and practical applications, such as understanding the basics of the physics of light or when designing complex optical systems.
Light travels at different speeds through various media, such as air, glass, or water. A “fast” medium is one where light moves more quickly compared to other materials.
- In a vacuum, light travels at 299,792 kilometres per second, but in other media, it slows down.
- In some cases, the speed is close to that in a vacuum, while in others, it is significantly slower.
- Knowing whether a medium is fast or slow helps predict how light will behave when it crosses from one medium to another.
- If light crosses from a fast medium to a slower one, it bends towards the normal.
- If light crosses from a slow medium to a faster one, it bends away from the normal.
- In optics, the normal is a line drawn perpendicular (at a 90° angle) to the boundary between two media in a ray diagram.
The frequency of electromagnetic radiation (light) refers to the number of wave-cycles of an electromagnetic wave that pass a given point in a given amount of time.
- Frequency is measured in Hertz (Hz) and signifies the number of wave-cycles per second. Sub-units of Hertz enable measurements involving a higher count of wave-cycles within a single second.
- The frequency of electromagnetic radiation spans a broad range, from radio waves with low frequencies to gamma rays with high frequencies.
- The wavelength and frequency of light are closely linked. Specifically, as the wavelength becomes shorter, the frequency increases correspondingly.
- It is important not to confuse the frequency of a wave with the speed at which the wave travels or the distance it covers.
- The energy carried by a light wave intensifies as its oscillations increase in number and its wavelength shortens.


