
Facts about the Sun
This diagram introduces the Sun, the star at the centre of our solar system. It lists some useful facts that help explain why it is so important in our lives.
Remember that:
Remember that:
- The sun is unlike anything else in our experience. Its age, size, temperature are all on a scale apart from life on planet Earth.
- It explodes with the force of a billion one-megaton nuclear bombs every single second of every single day.
- Without the energy produced by the sun, life as we know it would not be possible.
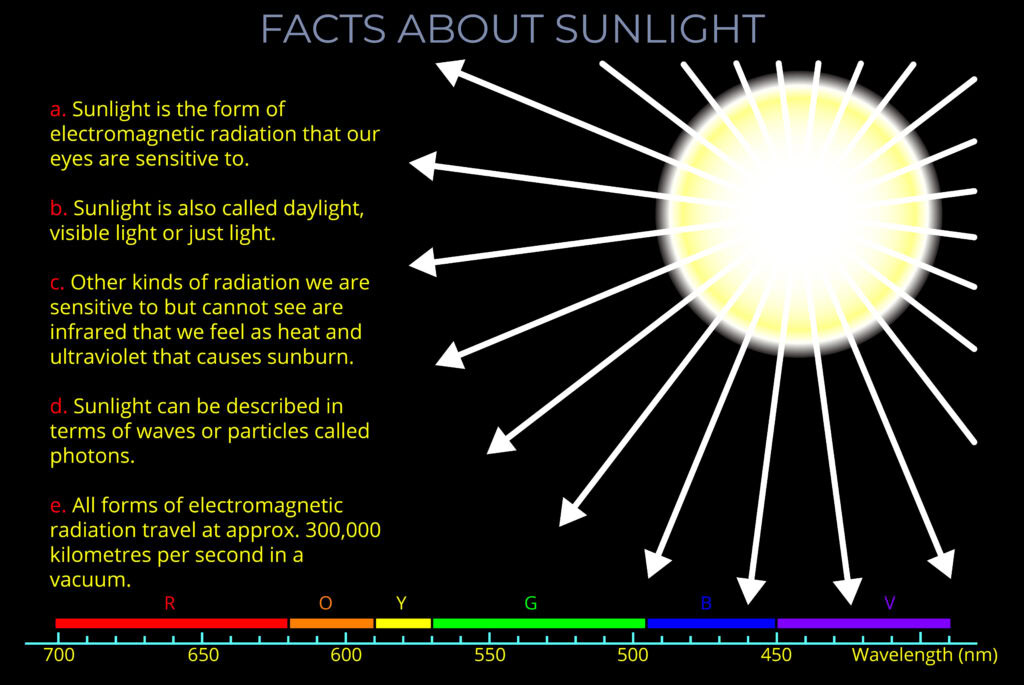
Facts about Sunlight
This diagram introduces sunlight, the light produced by the Sun, the star at the centre of our solar system.
It gathers together some useful facts and introduces some important terms that you can check out in the next section. Remember that:
It gathers together some useful facts and introduces some important terms that you can check out in the next section. Remember that:
- As the Sun explodes with the force of a billion one-megaton nuclear bombs every second it gives off electromagnetic radiation.
- Sunlight is a form of electromagnetic radiation.
- The electromagnetic radiation given off by the sun includes all wavelengths of the electromagnetic spectrum.
- By the time sunlight has passed through the atmosphere and reaches the ground it contains ...

Facts about White Light
This diagram introduces white light, the name given to light that contains all wavelength of the visible spectrum.
Remember that:
Remember that:
- White light contains all the wavelengths of the visible spectrum.
- White light contains all wavelengths of light that correspond with the colours of the rainbow.
- White light does not include infrared and ultraviolet wavelengths of light.
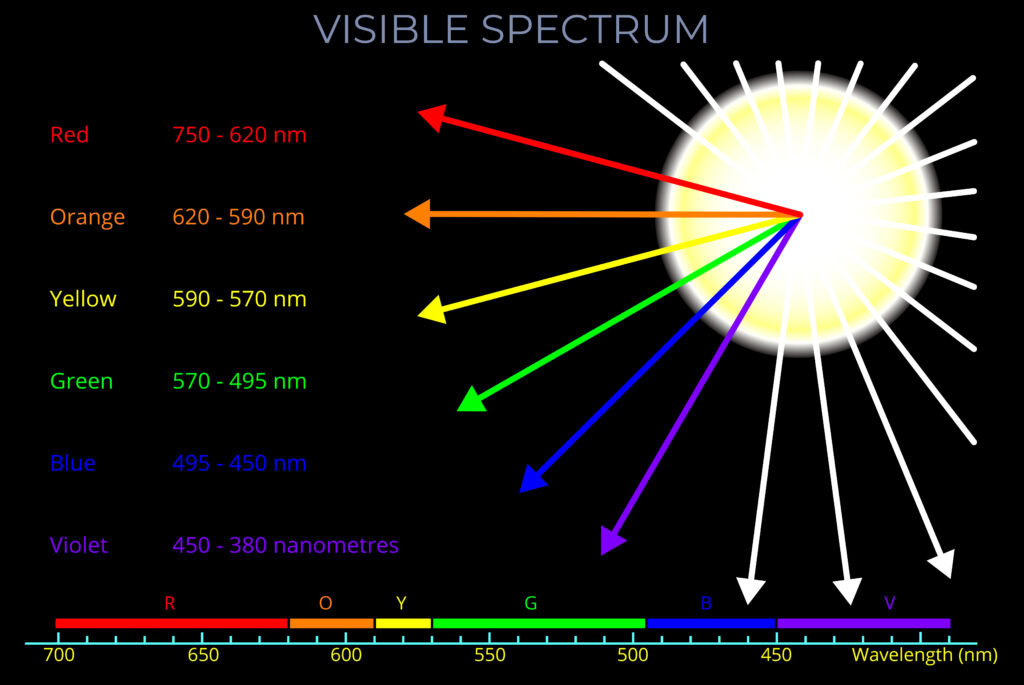
Visible Spectrum
This diagram is about sunlight, the visible spectrum and which wavelengths of electromagnetic radiation correspond with the different colours we see in the world.
The diagram shows that wavelengths of light within the visible spectrum correspond with the different colours we see in the world. Notice that:
The diagram shows that wavelengths of light within the visible spectrum correspond with the different colours we see in the world. Notice that:
- The white arrows in the diagram represent the Sun emitting sunlight at every wavelength of the visible spectrum.
- The term white light is used when all colours of the visible spectrum are mixed together.
- The coloured arrows represent six bands of wavelengths of visible light corresponding with red, orange, yellow, green, ...

Wavelengths from Red to Violet
This diagram is about which wavelengths of electromagnetic radiation correspond with the different colours we see in the world.
The important fact to remember is that the wavelengths of light within the visible spectrum correspond with all the colours that we see between red and violet.
The important fact to remember is that the wavelengths of light within the visible spectrum correspond with all the colours that we see between red and violet.
- The white arrows in the diagram show the Sun emitting sunlight at all wavelengths of the visible spectrum.
- The term white light is used when all colours of the visible spectrum are mixed together.
- The spectrum of colours between red and violet illustrates that although an observer will often describe visible light ...
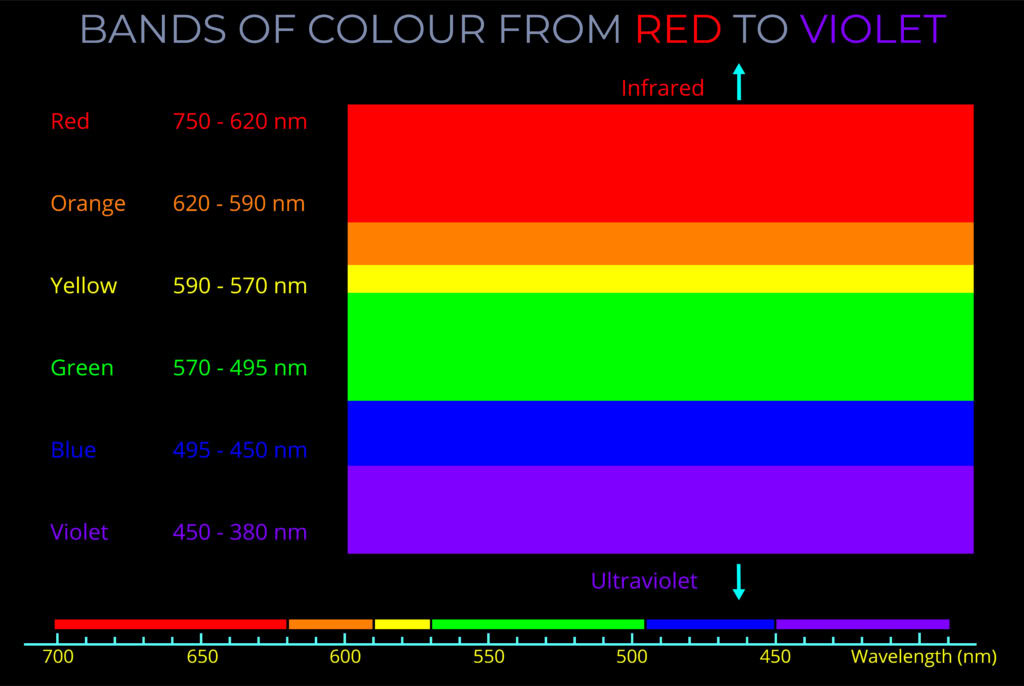
Bands of Colour from Red to Violet
This diagram is about the fact that wavelengths of light within the visible spectrum often appear to form bands of colour.
- Every wavelength of electromagnetic radiation (light) corresponds with a different colour we see in the world.
- When an observer sees a continuous range of wavelengths they see bands of colour.
- When all wavelengths within the visible spectrum are present an observer will often see six bands of colour - the colours of the rainbow, ROYGBV.
- The list on the left of the diagram shows the range of wavelengths corresponding with each band of colour.
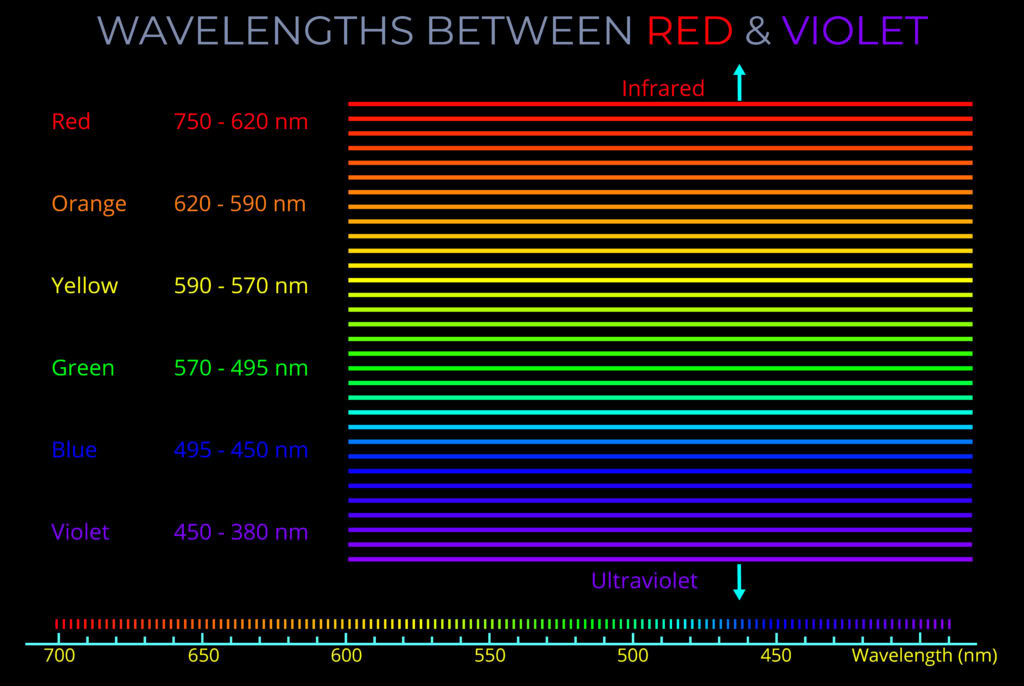
Wavelengths Between Red & Violet
This diagram is about which wavelengths of electromagnetic radiation correspond with the different colours we see in the world.
It shows that whilst the visible spectrum often appears to an observer to be made up of six bands of colour, every wavelength between 700 and 380 nanometres corresponds with a different colour. The scale along the bottom of the diagram is marked in nanometres with the corresponding colours shown above. Remember that:
It shows that whilst the visible spectrum often appears to an observer to be made up of six bands of colour, every wavelength between 700 and 380 nanometres corresponds with a different colour. The scale along the bottom of the diagram is marked in nanometres with the corresponding colours shown above. Remember that:
- Objects appear to be different colours to an observer depending on the wavelengths they reflect.
- The name given to light that contains all wavelengths of the ...
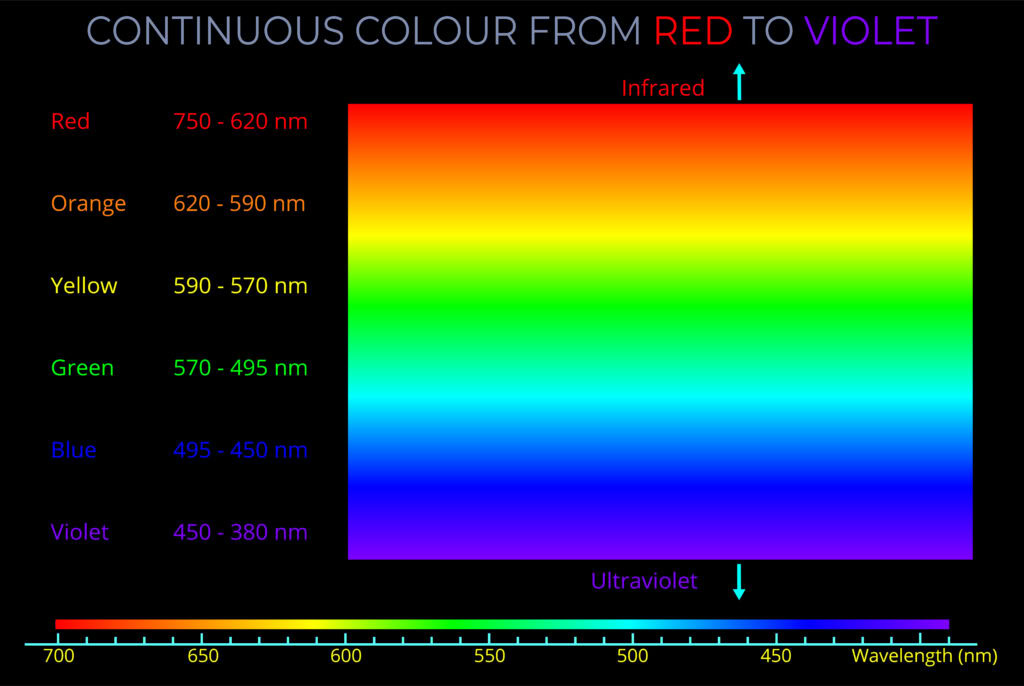
Continuous Colour from Red to Violet
This diagram shows six electromagnetic waves. Each wave corresponds with a colour within the visible spectrum that an observer might recognise.
Remember that:
Remember that:
- Electromagnetic waves, which are a form of electromagnetic radiation, propagating from a light source, travel through space and encounter different materials.
- Colour is not a property of electromagnetic radiation, but an aspect of visual perception.
- A human observer can distinguish between colours corresponding with many thousands of wavelengths of light in the visible spectrum. These colours are often called spectral colours.
- The largest part of the electromagnetic spectrum is outside the wavelengths of visible light ...
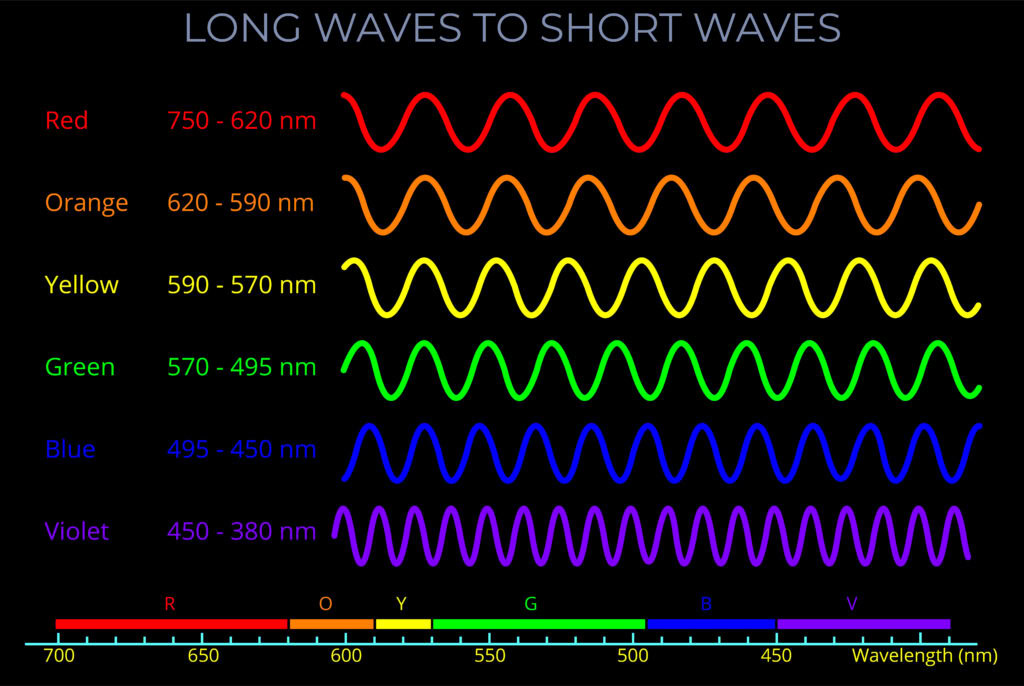
Long Waves to Short Waves
This diagram shows six electromagnetic waves. Each wave corresponds with a colour within the visible spectrum that an observer might recognise.
Remember that:
Remember that:
- Electromagnetic waves, which are a form of electromagnetic radiation, propagating from a light source, travel through space and encounter different materials.
- Colour is not a property of electromagnetic radiation, but an aspect of visual perception.
- A human observer can distinguish between colours corresponding with many thousands of wavelengths of light in the visible spectrum. These colours are often called spectral colours.
- The largest part of the electromagnetic spectrum is outside the wavelengths of visible light ...
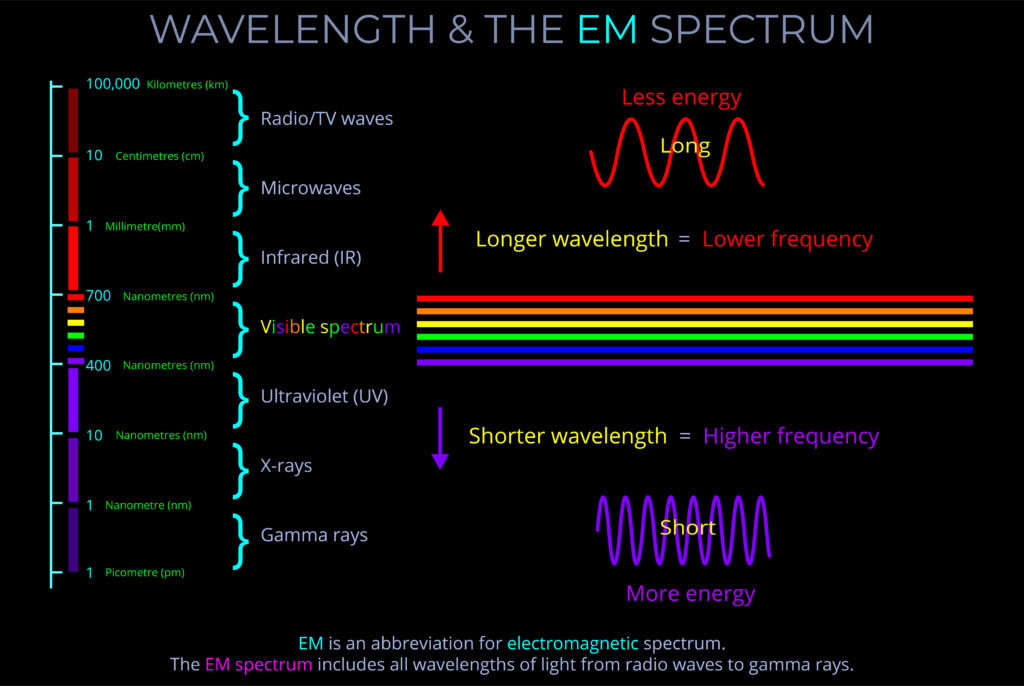
Wavelength & the EM Spectrum
This diagram shows that the electromagnetic spectrum includes waves with all possible wavelengths of radiation.
Notice that:
Notice that:
- Wavelengths range from low energy radio waves through visible light to high energy gamma rays.
- Waves with longer wavelengths have a lower frequency and carry less energy.
- Waves with shorter wavelengths have a higher frequency and carry more energy.
- The electromagnetic spectrum includes, in order of increasing frequency and decreasing wavelength: radio waves, microwaves, infrared radiation, visible light, ultraviolet radiation, X-rays and gamma rays.
- There are no precisely defined boundaries between the bands of electromagnetic radiation ...
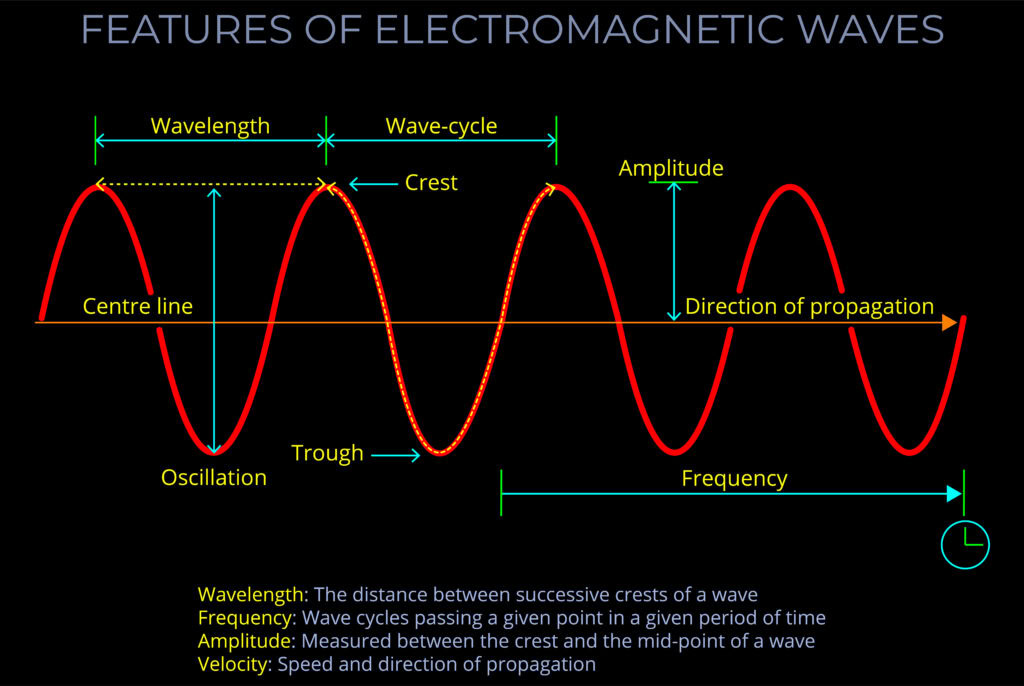
Features of Electromagnetic Waves
This diagram shows the key features of electromagnetic (light) waves and introduces some of the terms used to describe them.
- Across the centre is an electromagnetic wave, shown in red.
- The wave is travelling from left to right.
- The different features of the wave are shown by labels.
- At the bottom of the diagram are short definitions of key terms.
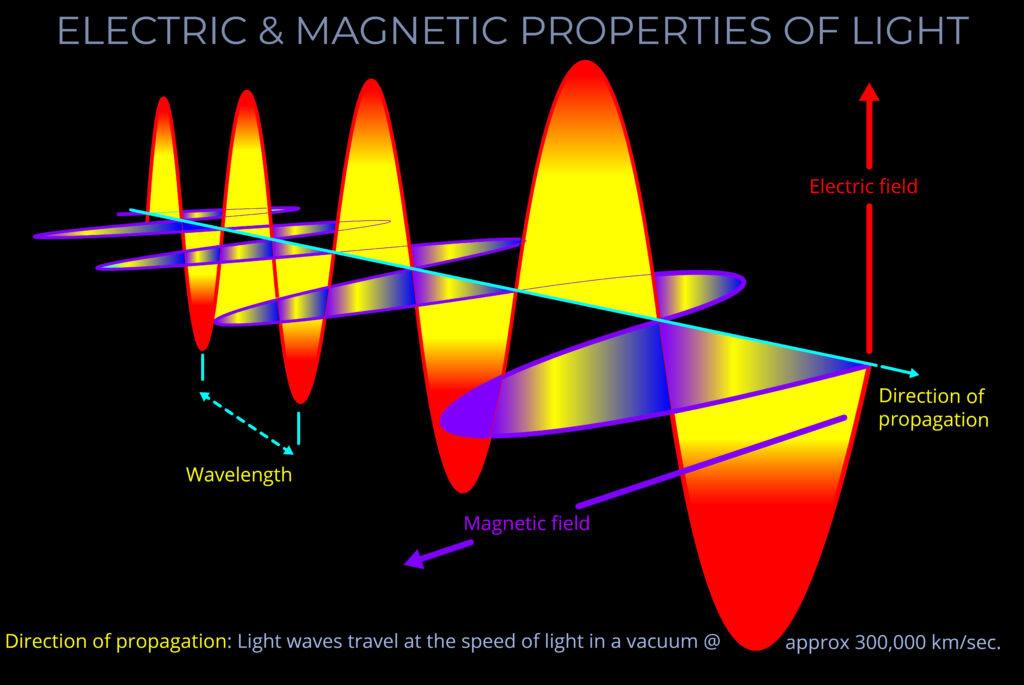
Electric & Magnetic Properties of Light
This diagram shows that an electromagnetic wave (lightwave) results from the interaction of an electric and magnetic field.
- Electromagnetic waves are produced by the Sun as a result of thermonuclear fusion.
- The explosive force of thermonuclear fusion is caused by gravity crushing hydrogen atoms until they collapse.
- The nuclear reaction forces hydrogen atoms to combine into helium atoms and release vast amounts of electrical and magnetic energy.
- The electrical and magnetic forces form fields which interact with each other to produce a wave pattern that radiates out into space at the speed of light.
- The electromagnetic waves are of ...

Comparing Wavelengths – Radio to Gamma
This diagram compares the wavelength of four electromagnetic waves and arranges them according to their position within the electromagnetic spectrum.
- Radio waves are shown at the top. They have the longest wavelength of the four types. These waves are shown as dull red. They are invisible to the human eye.
- Red has the longest wavelength of the visible part of the electromagnetic spectrum.
- Violet has the shortest wavelength of the visible part of the electromagnetic spectrum.
- Gamma rays are shown at the bottom. They have the shortest wavelength of the four types. These waves are shown as a dull ...

Comparing Wavelengths of Red & Violet
This diagram compares the wavelength of two electromagnetic waves that correspond with an observer's perception of red and violet.
- The diagram also looks at the units used when wavelength is being measured.
- Notice that the wavelength of the red wave is much longer than the violet wave.
- The wave cycle is measured from peak to peak and is marked by the dotted line.
- The amplitude of both waves is the same.
- Because the wavelength of the violet wave is shorter than the red its frequency is higher.
- The unit of measurement of wavelength is the metre.
- Because the ...
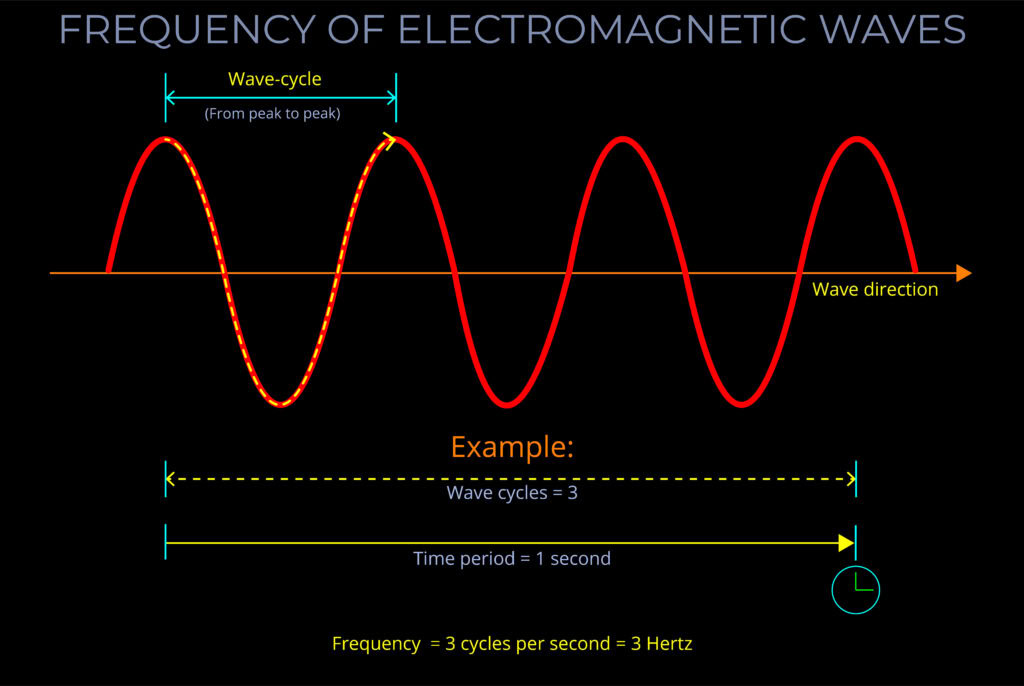
Frequency of Electromagnetic Waves
This diagram looks at the frequency of electromagnetic waves.
- It shows that the frequency of electromagnetic radiation (light) refers to the number of wave-cycles of an electromagnetic wave that pass a given point in a given amount of time.
- The frequency of an electromagnetic wave can be thought about in the same way as the frequency of trains that pass through a railway station. If a train passes through a station every 10 minutes then the frequency is six trains per hour.
- The frequency of a wave should not be confused with the speed at ...
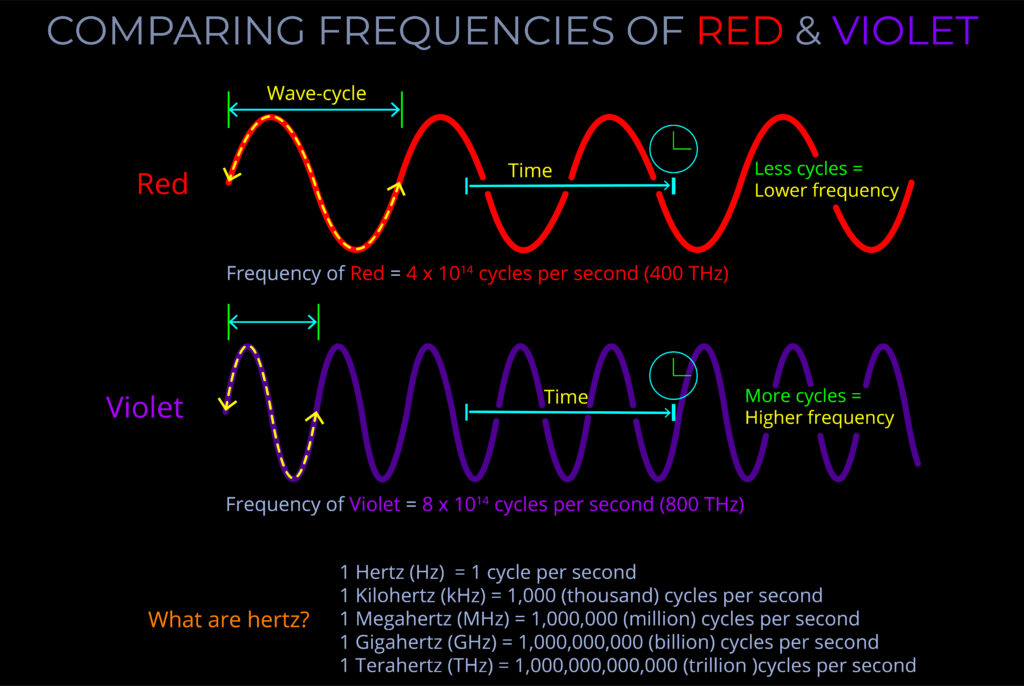
Comparing Frequencies of Red & Violet
This diagram compares the frequency of two electromagnetic waves that correspond with an observer's perception of red and violet.
The diagram shows that the frequency of electromagnetic waves (light) refers to the number of oscillations that pass a given point in a given amount of time. Understanding the diagram
The diagram shows that the frequency of electromagnetic waves (light) refers to the number of oscillations that pass a given point in a given amount of time. Understanding the diagram
- The diagram shows a total of three wave-cycles for red and eight wave-cycles for violet. The length of one wave-cycle (oscillation) is shown as a yellow arrow drawn on each wave.
- The point at which measurement of passing waves is taken is shown as a vertical line below a clock face whilst the ...
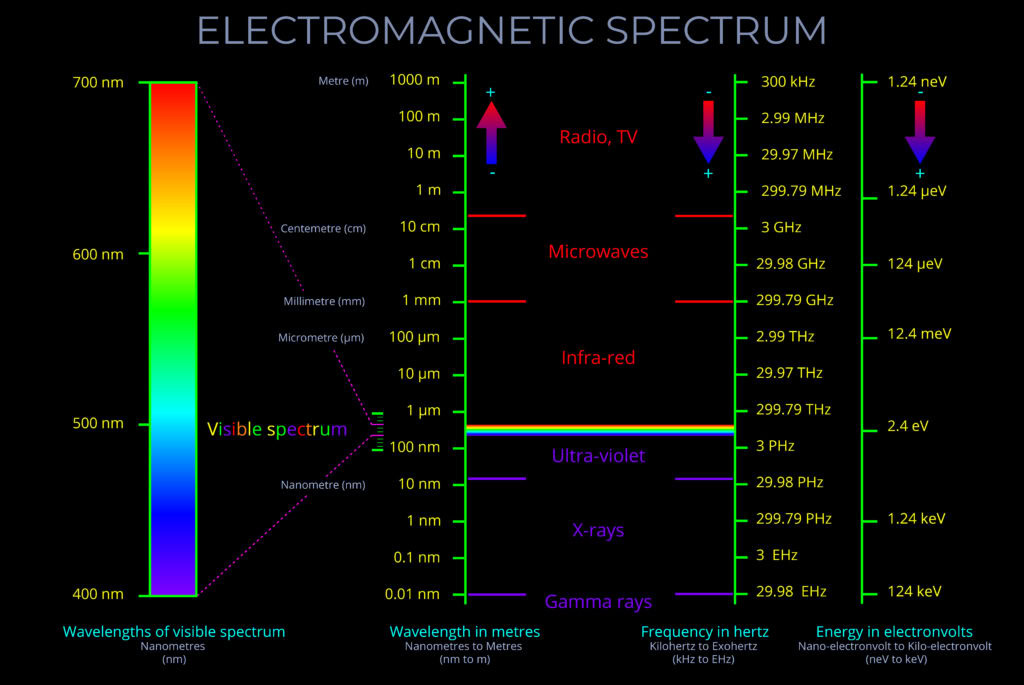
Electromagnetic Spectrum
This diagram shows that the electromagnetic spectrum includes waves with all possible wavelengths, ranging from low energy radio waves through visible light to high energy gamma rays.
- Notice that a wave with a longer wavelength has a lower frequency and carries less energy.
- Notice that a wave with a shorter wavelength has a higher frequency and carries more energy.
- The electromagnetic spectrum includes, in order of increasing frequency and decreasing wavelength: radio waves, microwaves, infrared radiation, visible light, ultraviolet radiation, X-rays and gamma rays.
- There are no precisely defined boundaries between the bands of electromagnetic ...
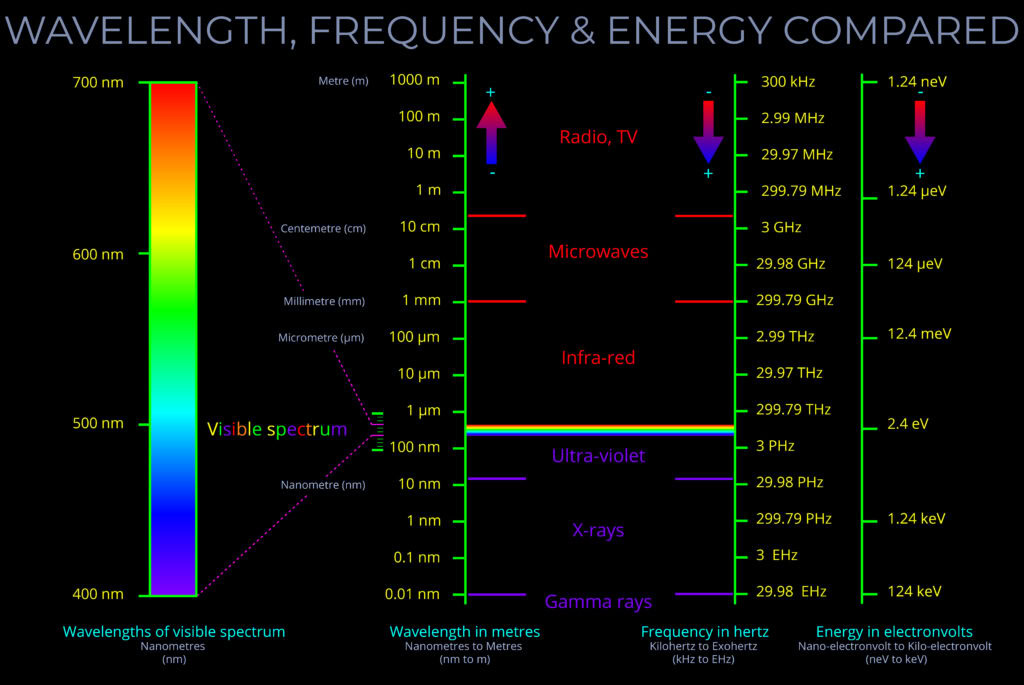
Wavelength Frequency & Energy Compared
This diagram of the electromagnetic spectrum shows how wavelength, frequency and energy are related to one another.
- The diagram shows that the electromagnetic spectrum can be described as bands of electromagnetic radiation. Radio waves which have the longest wavelengths and the lowest frequency appear at the top of the diagram whilst gamma rays which have the shortest wavelengths but the highest frequencies appear at the bottom.
- A magnified view of the visible spectrum is shown on the left of the diagram. It forms a very small band of wavelengths, frequencies and energies within the electromagnetic spectrum as a whole. ...
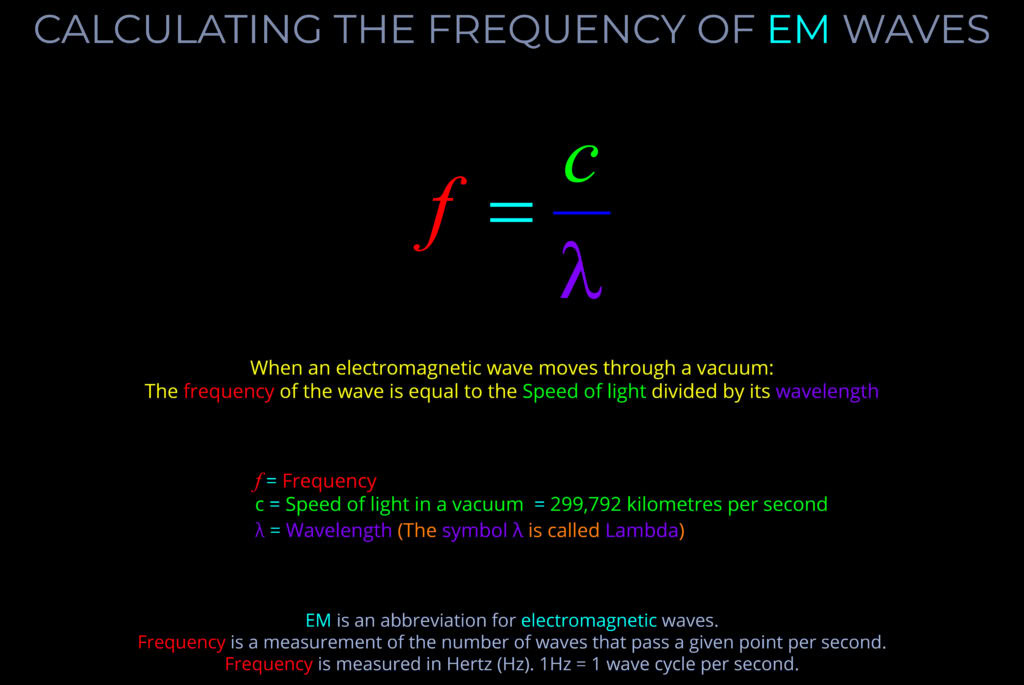
Calculating the Frequency of EM Waves
This diagram is a new addition to the site! More information will be added ASAP 🙂 ...
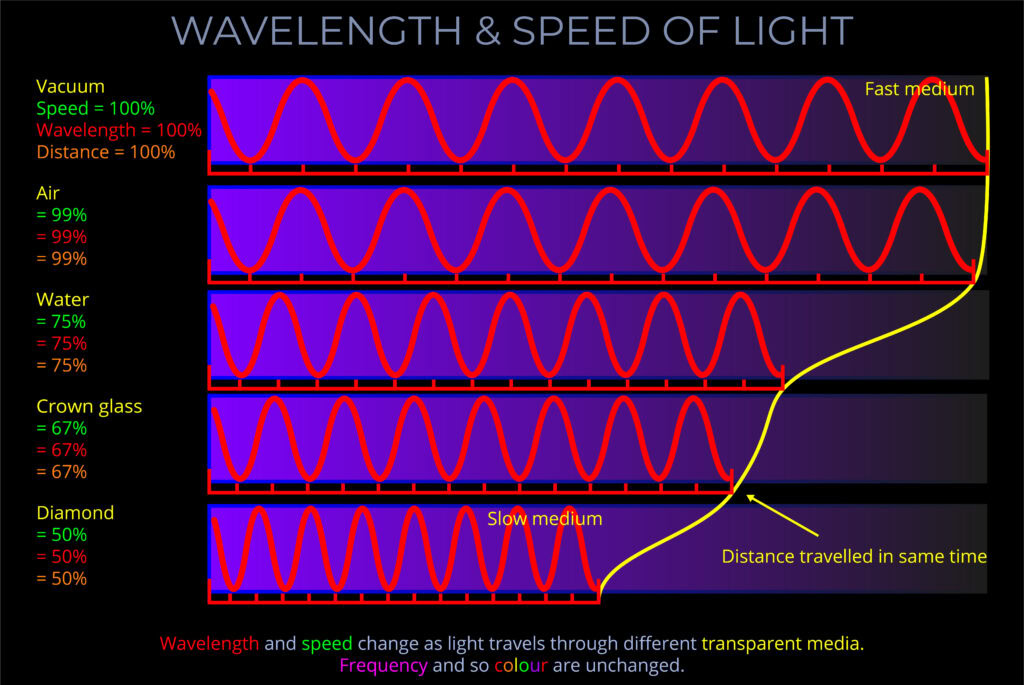
Wavelength & Speed of Light
This diagram shows the waveform of rays of red light (electromagnetic radiation) travelling through equally sized blocks of different transparent materials.
- The top block contains a vacuum so the speed of light, the wavelength and the distance travelled are all shown to be 100%.
- The diagram then illustrates the relative speed, wavelength and distance travelled as light passes through each of the other materials.
- The speed of light in a vacuum is 299,792 kilometres per second. Different media reduce that speed by different amounts depending on their optical density.
- Optically rare medium (air) = a faster medium = ...
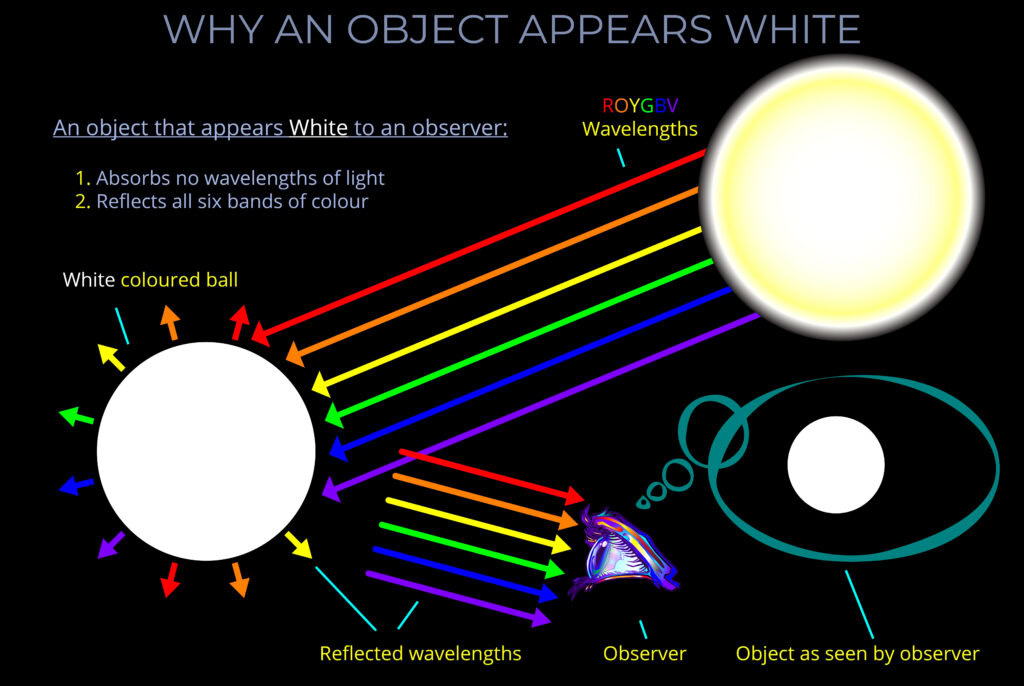
Why an Object Appears White
This is one of a set of 10 diagrams exploring why objects appear to be different colours to an observer.
There are always three key factors that affect the colour of an object.
There are always three key factors that affect the colour of an object.
- The first is the type of light source and what happens to the light on its journey towards an object.
- The second is what happens when light strikes different types of objects and materials.
- The third concerns factors related to the observer which affect what they see and how things appear.
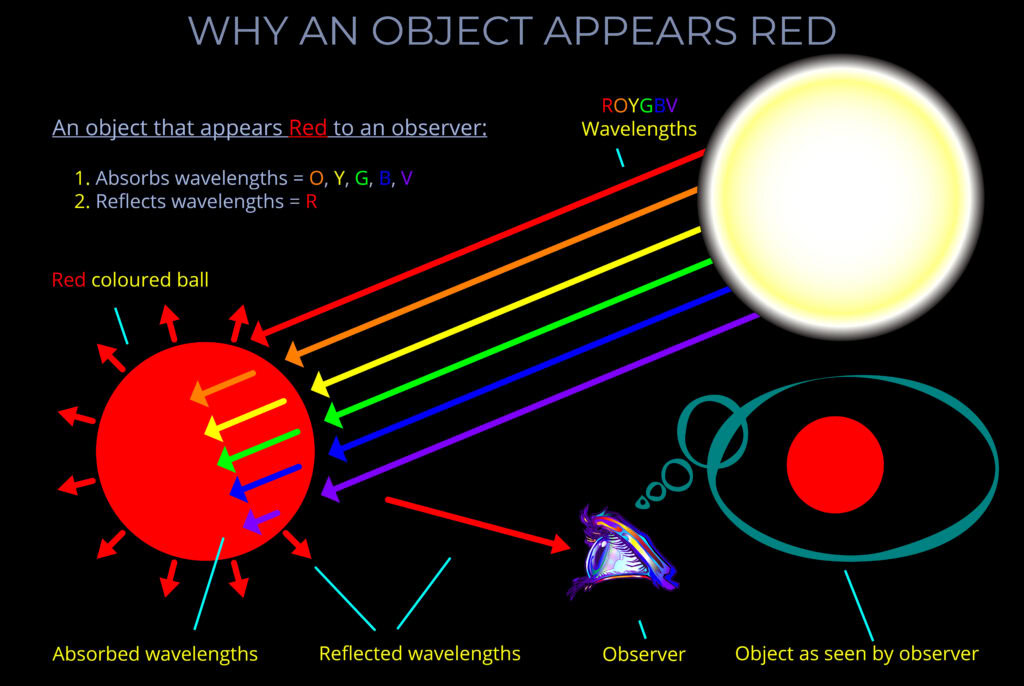
Why an Object Appears Red
This is one of a set of 10 diagrams exploring why objects appear to be different colours to an observer.
There are always three key factors that affect the colour of an object.
There are always three key factors that affect the colour of an object.
- The first is the type of light source and what happens to the light on its journey towards an object.
- The second is what happens when light strikes different types of objects and materials.
- The third concerns factors related to the observer which affect what they see and how things appear.
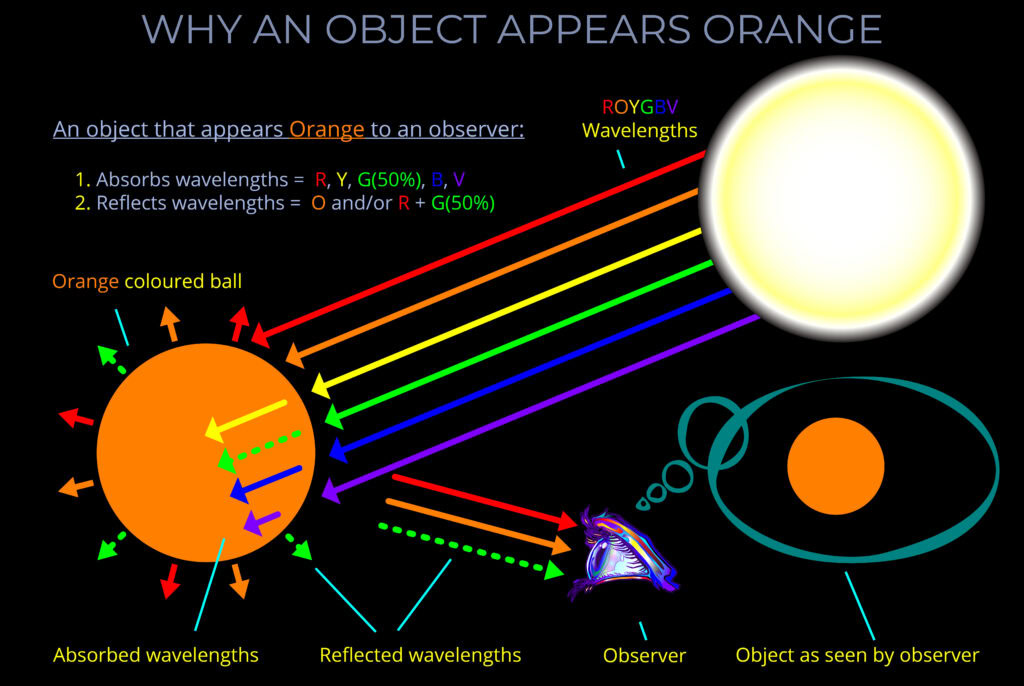
Why an Object Appears Orange
This is one of a set of 10 diagrams exploring why objects appear to be different colours to an observer.
There are always three key factors that affect the colour of an object.
There are always three key factors that affect the colour of an object.
- The first is the type of light source and what happens to the light on its journey towards an object.
- The second is what happens when light strikes different types of objects and materials.
- The third concerns factors related to the observer which affect what they see and how things appear.
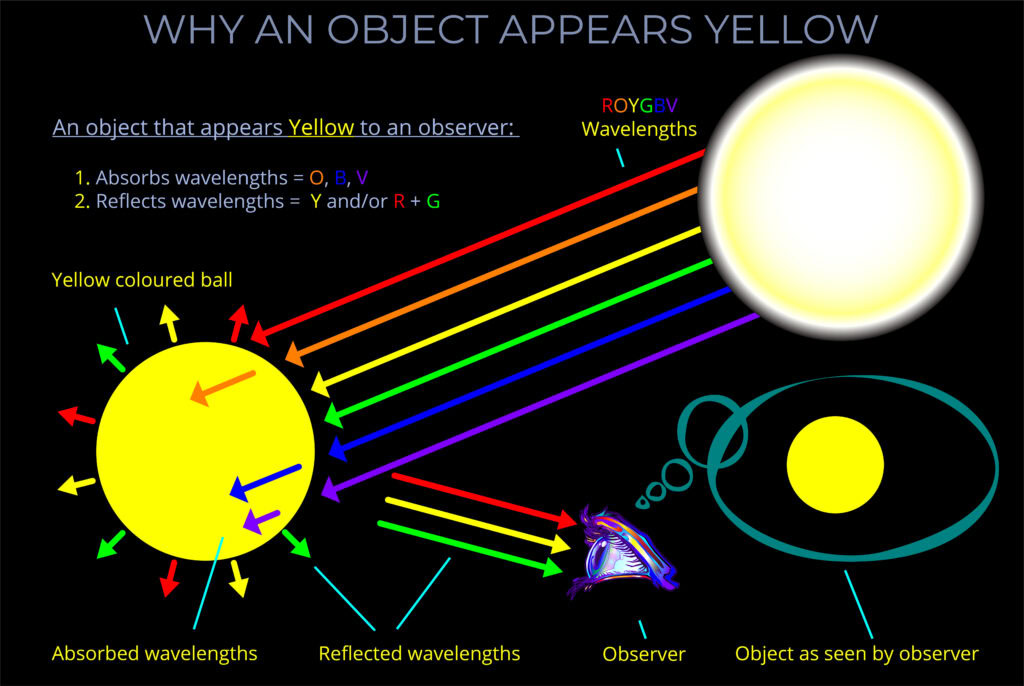
Why an Object Appears Yellow
This is one of a set of 10 diagrams exploring why objects appear to be different colours to an observer.
There are always three key factors that affect the colour of an object.
There are always three key factors that affect the colour of an object.
- The first is the type of light source and what happens to the light on its journey towards an object.
- The second is what happens when light strikes different types of objects and materials.
- The third concerns factors related to the observer which affect what they see and how things appear.
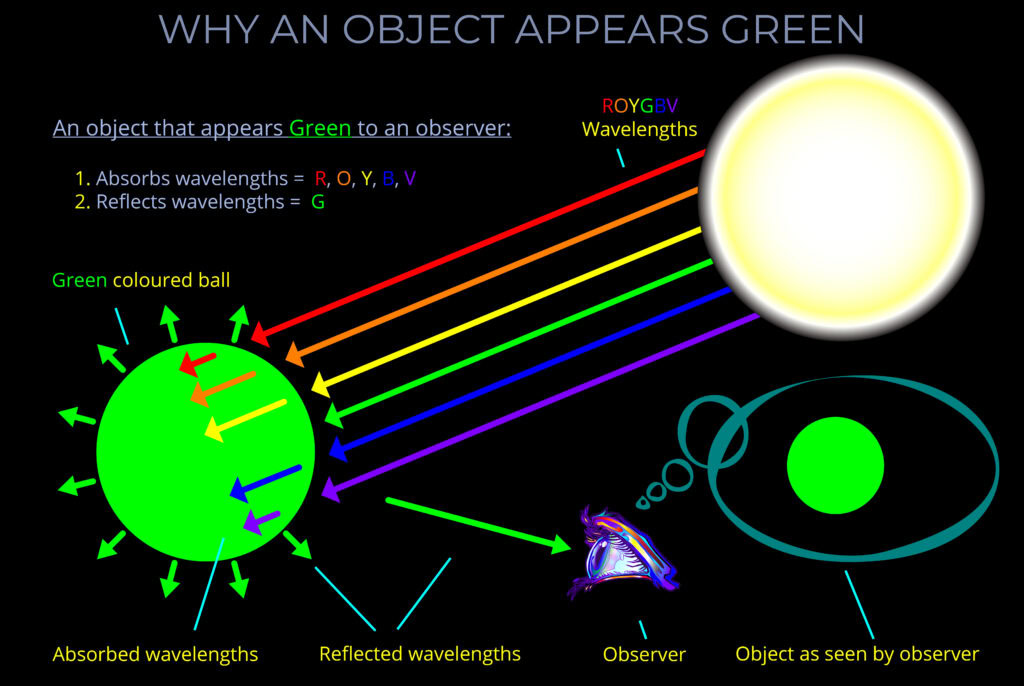
Why an Object Appears Green
This is one of a set of 10 diagrams exploring why objects appear to be different colours to an observer.
There are always three key factors that affect the colour of an object.
There are always three key factors that affect the colour of an object.
- The first is the type of light source and what happens to the light on its journey towards an object.
- The second is what happens when light strikes different types of objects and materials.
- The third concerns factors related to the observer which affect what they see and how things appear.
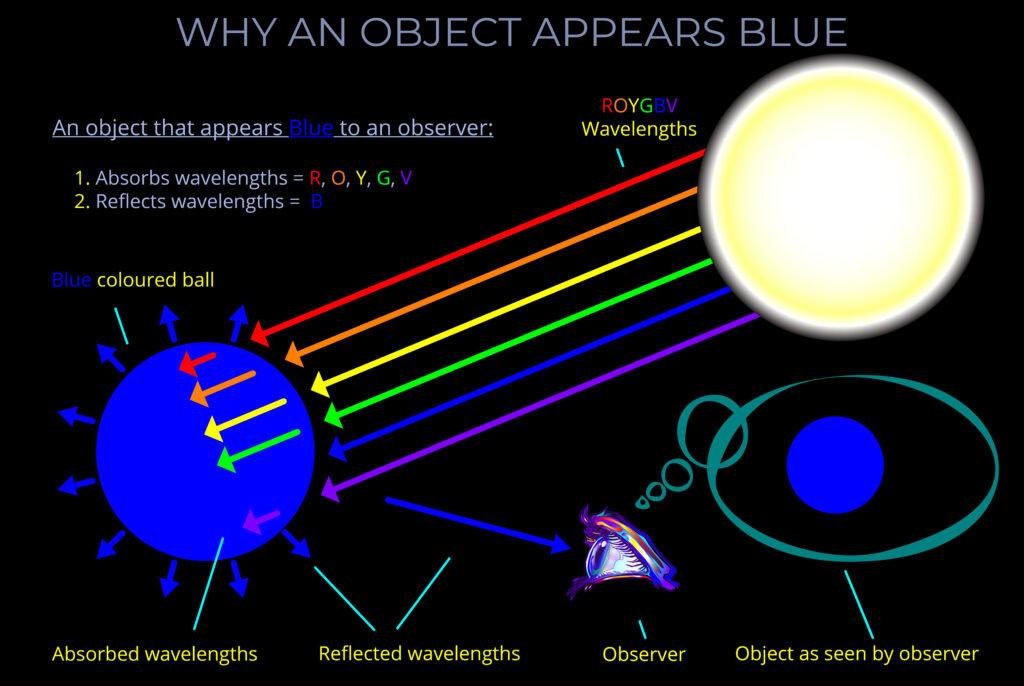
Why an Object Appears Blue
This is one of a set of 10 diagrams exploring why objects appear to be different colours to an observer.
There are always three key factors that affect the colour of an object.
There are always three key factors that affect the colour of an object.
- The first is the type of light source and what happens to the light on its journey towards an object.
- The second is what happens when light strikes different types of objects and materials.
- The third concerns factors related to the observer which affect what they see and how things appear.
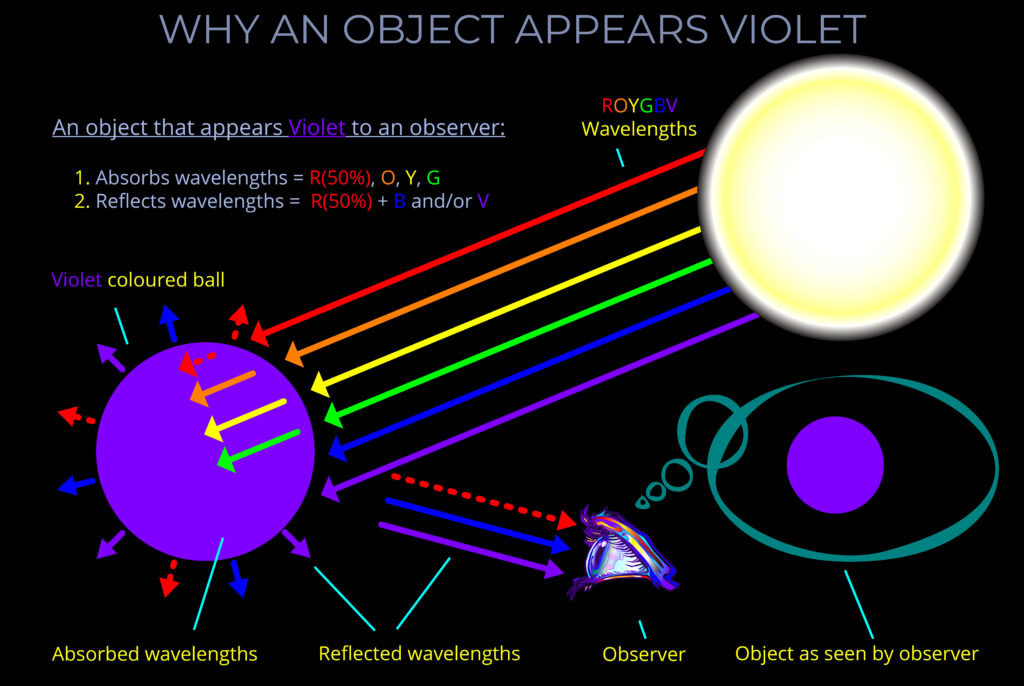
Why an Object Appears Violet
This is one of a set of 10 diagrams exploring why objects appear to be different colours to an observer.
There are always three key factors that affect the colour of an object.
There are always three key factors that affect the colour of an object.
- The first is the type of light source and what happens to the light on its journey towards an object.
- The second is what happens when light strikes different types of objects and materials.
- The third concerns factors related to the observer which affect what they see and how things appear.
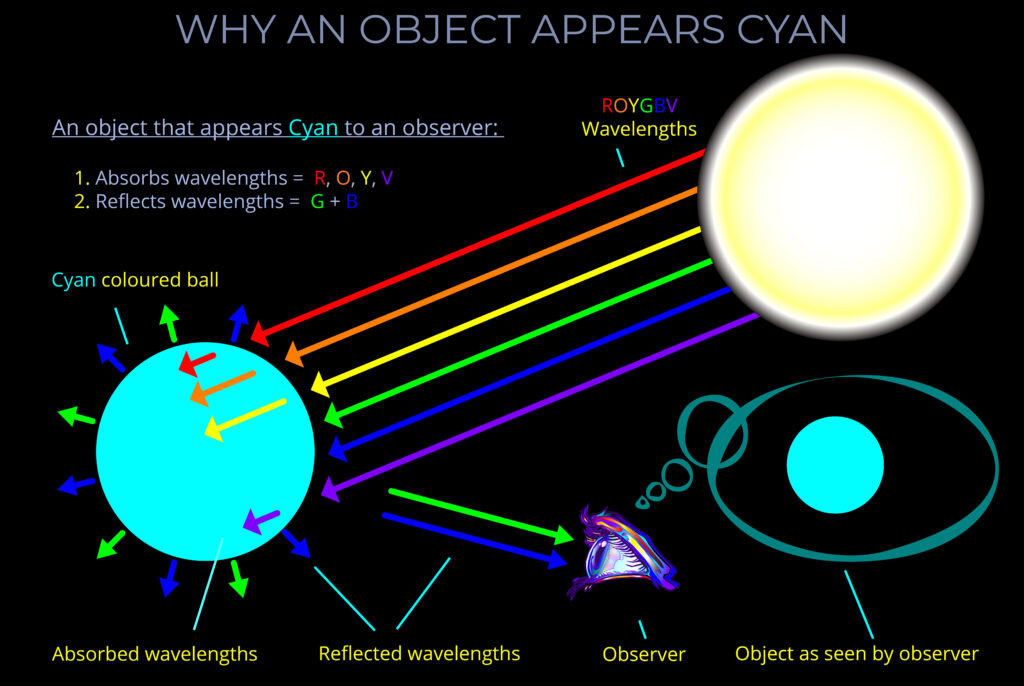
Why an Object Appears Cyan
This is one of a set of 10 diagrams exploring why objects appear to be different colours to an observer.
There are always three key factors that affect the colour of an object.
There are always three key factors that affect the colour of an object.
- The first is the type of light source and what happens to the light on its journey towards an object.
- The second is what happens when light strikes different types of objects and materials.
- The third concerns factors related to the observer which affect what they see and how things appear.
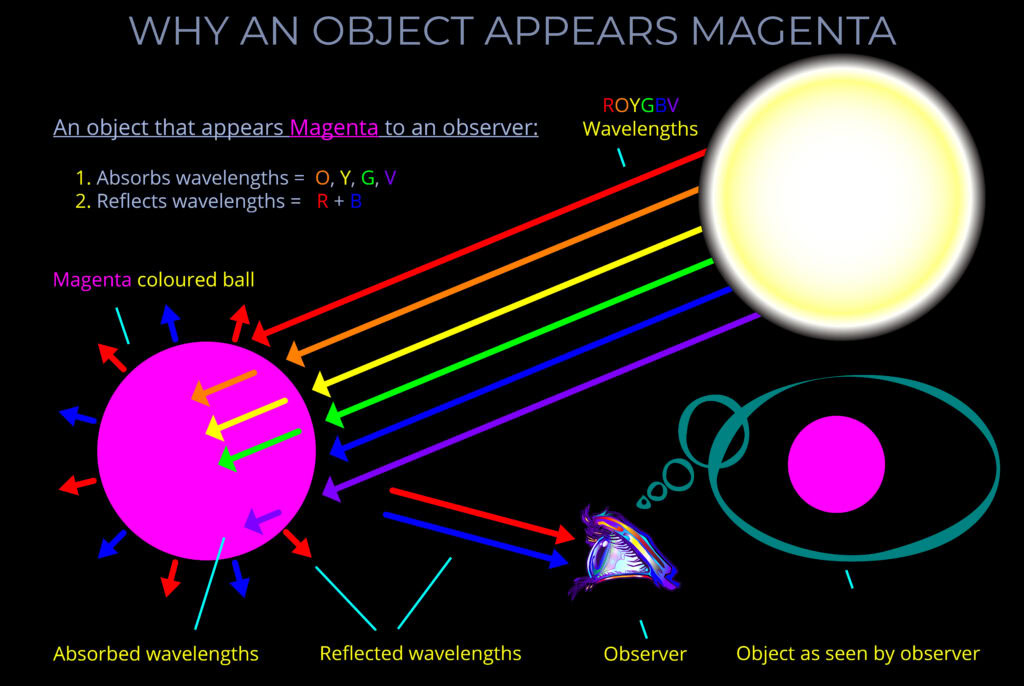
Why an Object Appears Magenta
This is one of a set of 10 diagrams exploring why objects appear to be different colours to an observer.
There are always three key factors that affect the colour of an object.
There are always three key factors that affect the colour of an object.
- The first is the type of light source and what happens to the light on its journey towards an object.
- The second is what happens when light strikes different types of objects and materials.
- The third concerns factors related to the observer which affect what they see and how things appear.
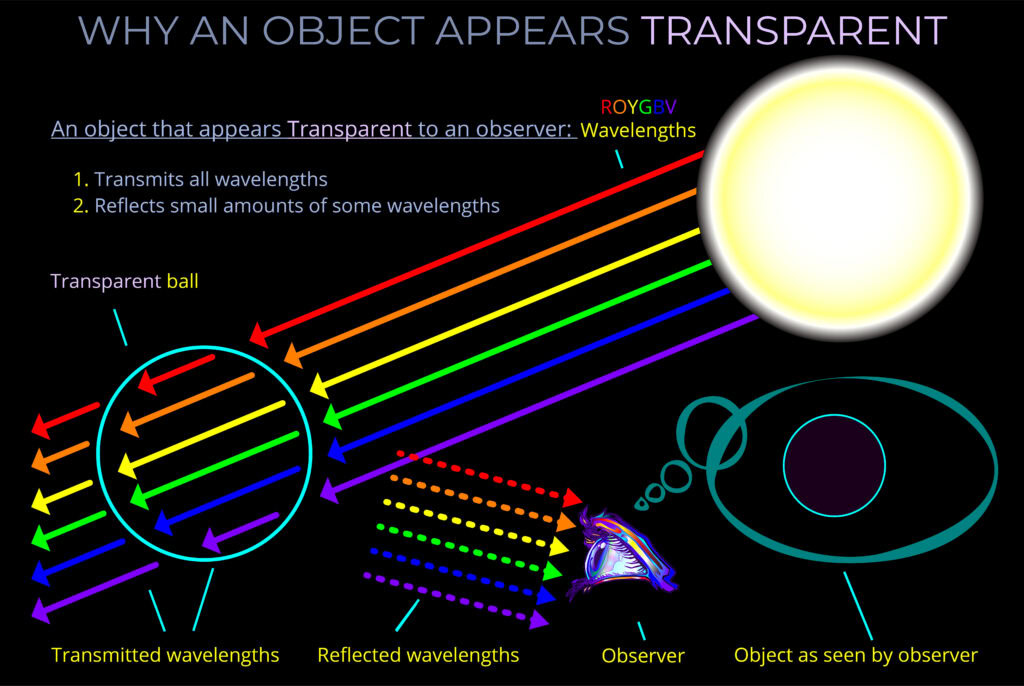
Why an Object Appears Transparent
This is one of a set of 10 diagrams exploring why objects appear to be different colours to an observer.
There are always three key factors that affect the colour of an object.
There are always three key factors that affect the colour of an object.
- The first is the type of light source and what happens to the light on its journey towards an object.
- The second is what happens when light strikes different types of objects and materials.
- The third concerns factors related to the observer which affect what they see and how things appear.
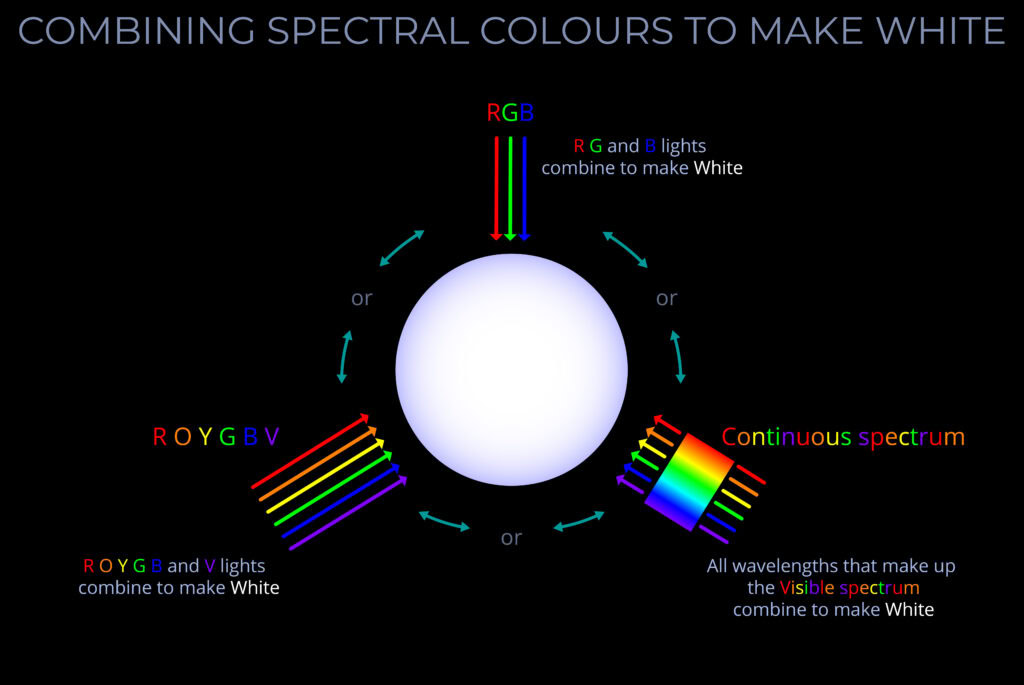
Combining Spectral Colours to Make White
This diagram looks at three situations in which an observer will see white light reflected off a dark surface.
Three different light sources are shown in the diagram.
Three different light sources are shown in the diagram.
- Each light source produces a different combination of wavelengths and each wavelength has the same intensity.
- The light source at the top of the diagram contains three component colours: RGB (red, green, blue).
- The light source on the left contains six component colours - ROYGBV (red, orange, yellow, green, blue and violet).
- The light source on the right contains a continuous spectrum of wavelengths which means it contains many thousands ...
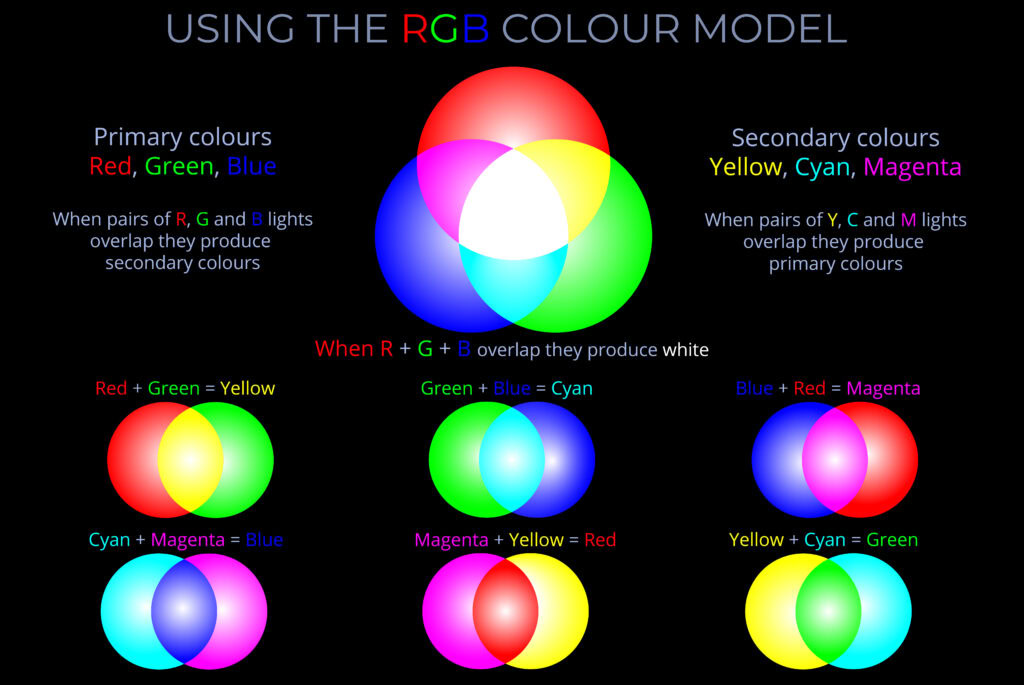
Using The RGB Colour Model
This diagram explores the RGB colour model. It looks at how wavelengths of light corresponding with the RGB primary colours are combined to produce secondary colours.
What you need to remember:
What you need to remember:
- Mixing different wavelengths of light to produce other colours, is called an additive colour model or an additive approach to colour.
- Red, green and blue (RGB) are additive primary colours. This means that when these wavelengths of light are projected onto a dark surface they combined to produce other colours.
- If wavelengths of light corresponding with all three additive primary colours are projected in equal amounts onto ...
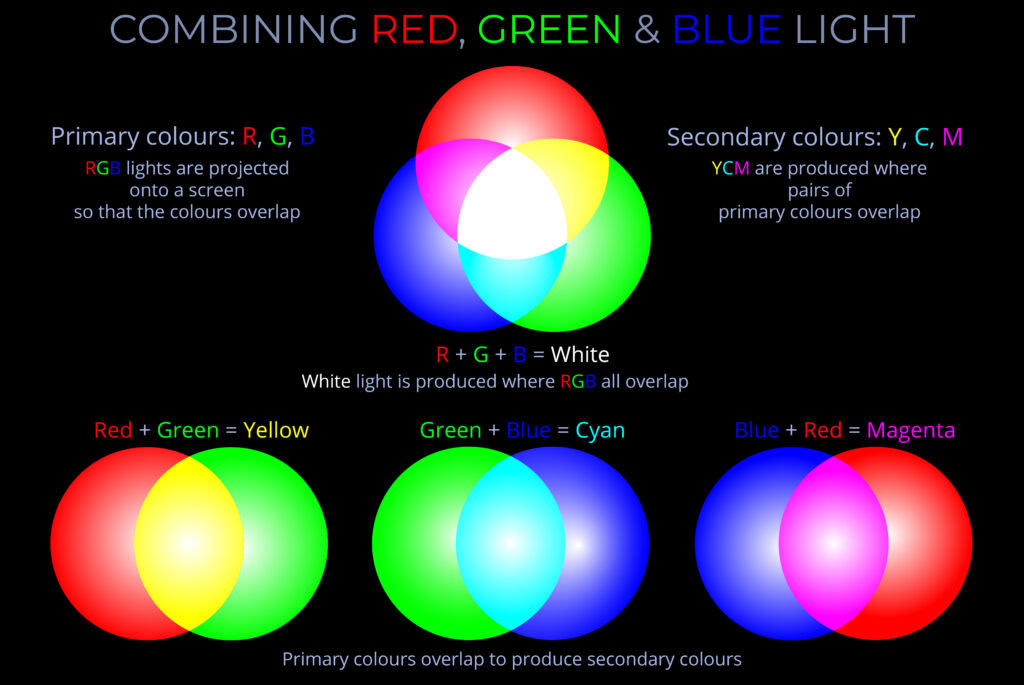
Combining Red Green & Blue Light
This diagram explains what happens when red, green and blue primary colours are projected onto a dark surface so that they overlap.
What you need to remember:
What you need to remember:
- Mixing different wavelengths of light to produce other colours, is called an additive colour model or an additive approach to colour.
- Red, green and blue (RGB) are additive primary colours. This means that when these wavelengths of light are projected onto a dark surface they combined to produce other colours.
- If wavelengths of light corresponding with all three additive primary colours are projected in equal amounts onto a dark surface the ...
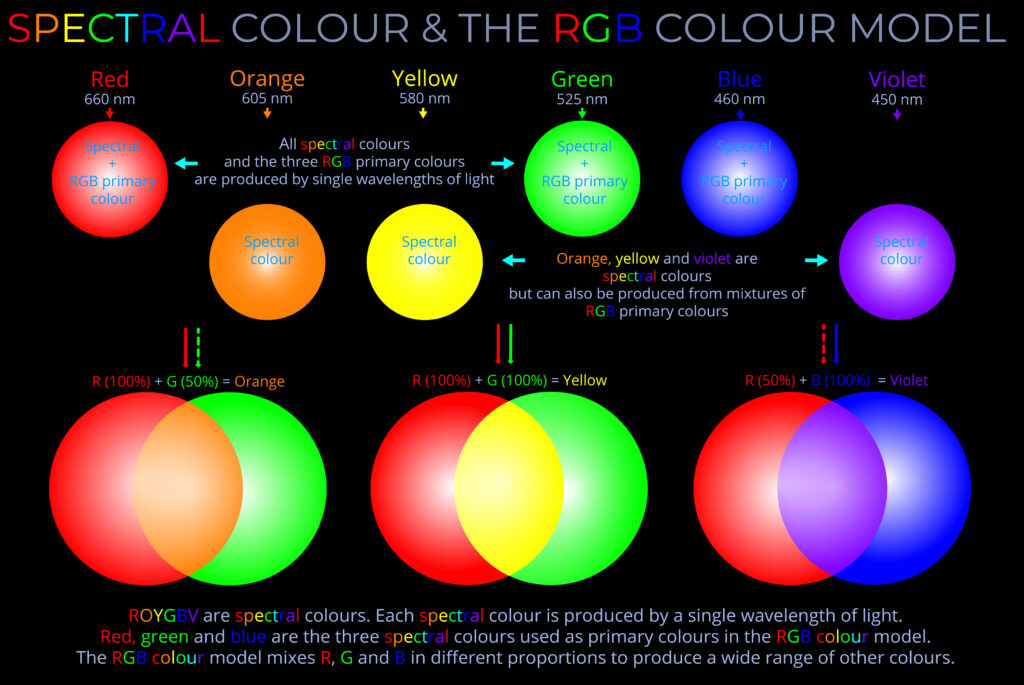
Spectral Colour & the RGB Colour Model
This diagram shows six spectral colours, red, orange, yellow, green, blue and violet.
- Spectral colours are produced by a single wavelength of light.
- Some spectral colours can also be produced by mixing two wavelengths of light together.
- Above the line of coloured circles are the wavelengths of light that produce each spectral colour.
- Of the six colours (ROYGBV), red, green and blue can only be produced by a single wavelength of light.
- The other three spectral colours, orange, yellow and violet, can be produced either by a single wavelength of light or by additive ...
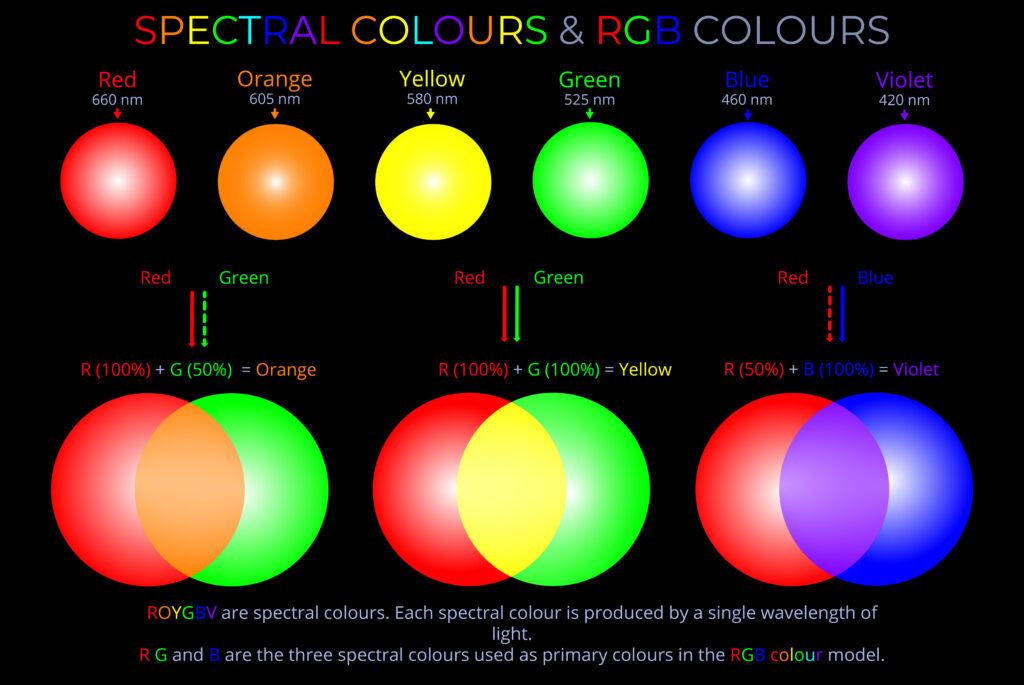
Spectral Colours & RGB Colours
This diagram shows the six spectral colours associated with the colours of the rainbow.
- The top half of the diagram shows that each of these spectral colours can be produced by a single wavelength of light.
- The bottom half of the diagram shows that three spectral colours (red, green and blue) can be combined in pairs to produce orange, yellow and violet.
- Spectral colours are produced by a single wavelength of light. So each individual wavelength of visible light produces a different spectral colour.
- Rainbows are produced by spectral colours as sunlight is refracted and ...
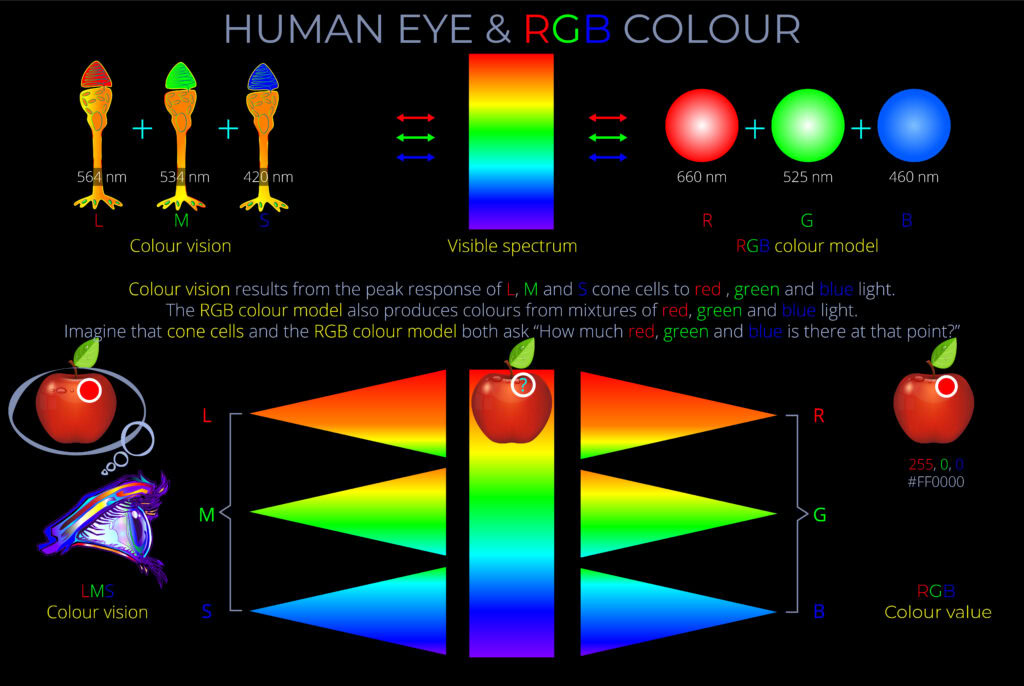
Human Eye & RGB Colour
This diagram is about the perception of colour. It explores how our eyes respond to wavelengths of light corresponding with red, green and blue.
- As we look at the world on a sunny day a vast range of wavelengths of visible light enter our eyes. Each wavelength corresponds with the perception of a different spectral colour.
- When wavelengths of light corresponding with only red, green and blue enter the eye in different proportions, our eyes are still able to see a full gamut of colours.
- The colours we see when wavelengths corresponding with just red, green and blue light ...
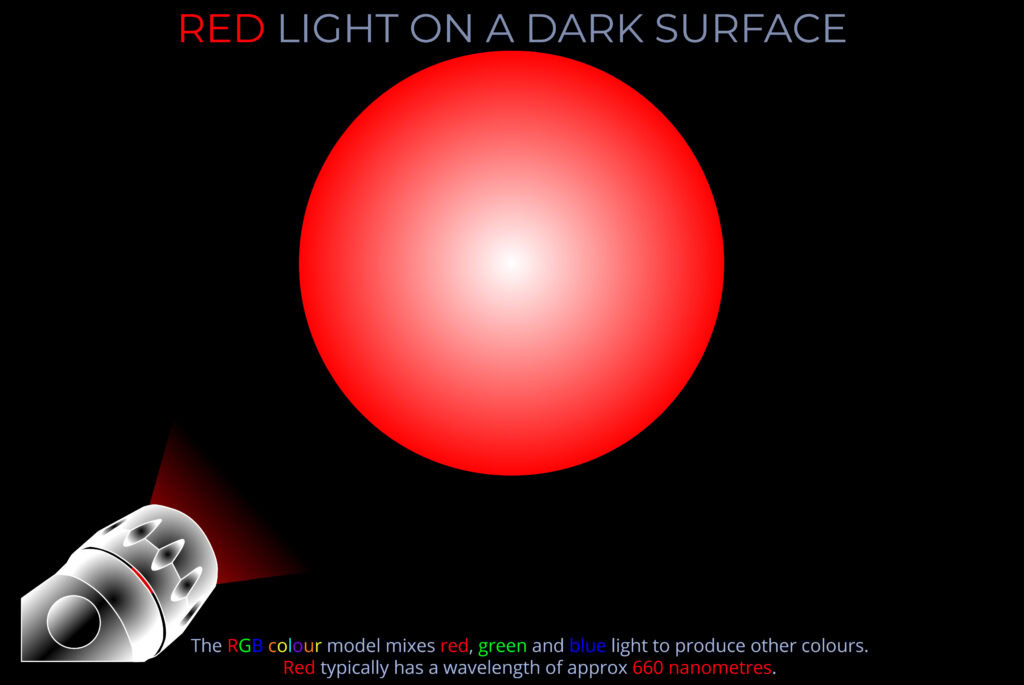
Red Light on a Dark Surface
This is one of a set of 3 diagrams showing torches projecting red, green and blue light onto a neutral coloured surface.
A fourth diagram shows what happens when all three torches are turned on at the same time and their beams partially overlap one another. Understanding the diagrams:
A fourth diagram shows what happens when all three torches are turned on at the same time and their beams partially overlap one another. Understanding the diagrams:
- The diagrams illustrate how the RGB colour model works in practice.
- Each torch emits light at the same intensity.
- Each torch points towards a different area of the surface.
- The light in each case is of a single wavelength so produces a spectral colour.
- The selected wavelengths are: red ...
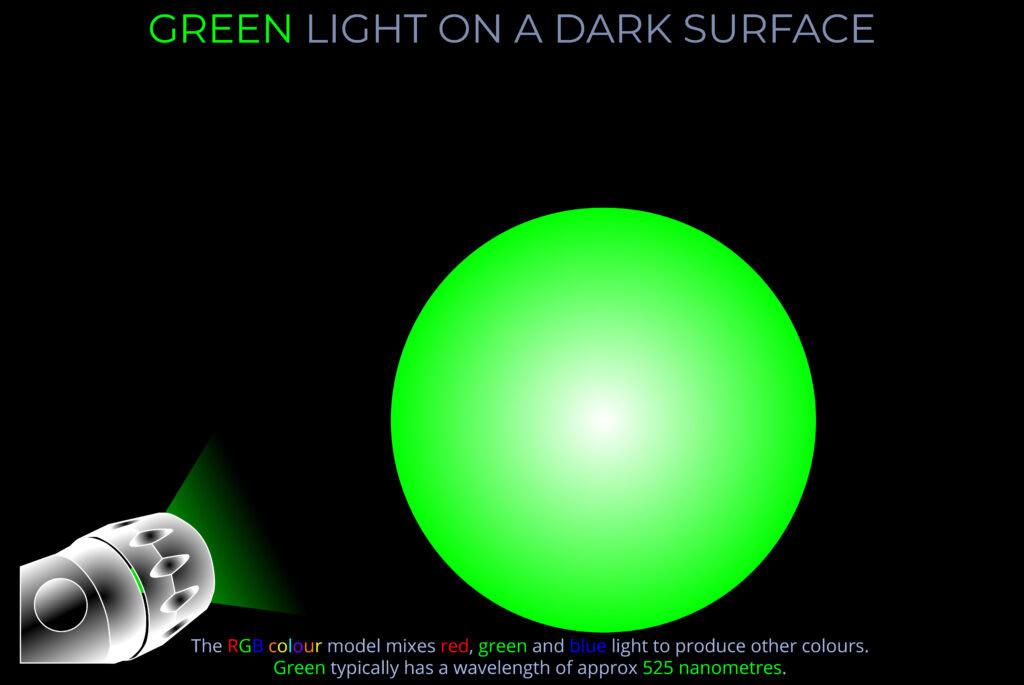
Green Light on a Dark Surface
This is one of a set of 3 diagrams showing torches projecting red, green and blue light onto a neutral coloured surface.
A fourth diagram shows what happens when all three are on at the same time and their beams partially overlap one another. Understanding the diagrams:
A fourth diagram shows what happens when all three are on at the same time and their beams partially overlap one another. Understanding the diagrams:
- The diagrams illustrate how the RGB colour model works in practice.
- Each torch emits light at the same intensity.
- Each torch points towards a different area of the surface.
- The light in each case is of a single wavelength so produces a spectral colour.
- The selected wavelengths are: red = 660 ...
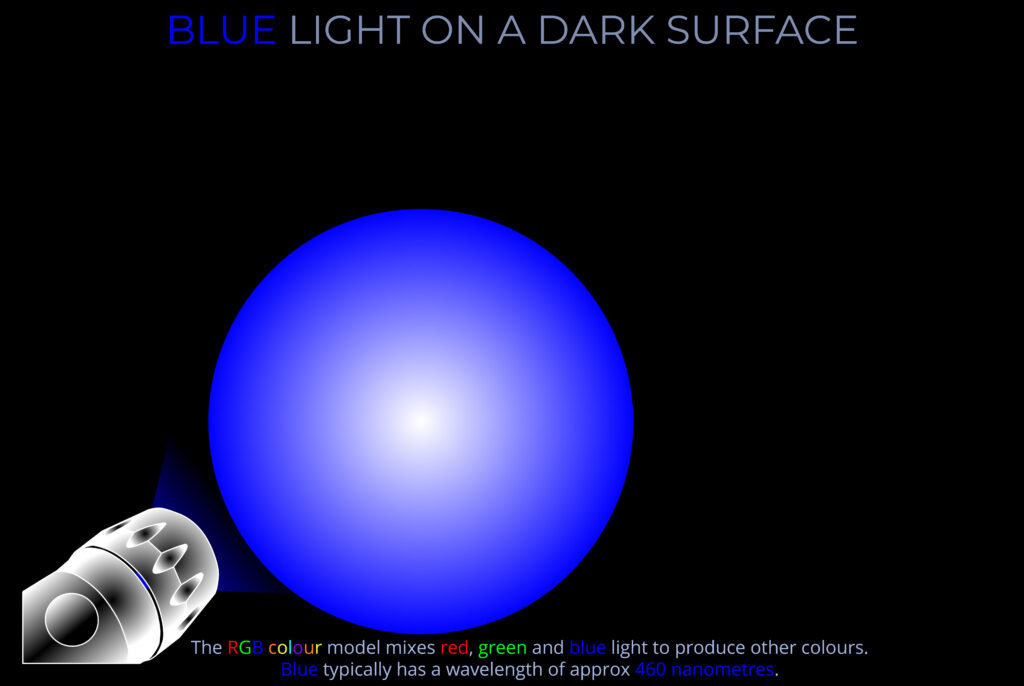
Blue Light on a Dark Surface
This is one of a set of 3 diagrams showing torches projecting red, green and blue light onto a neutral coloured surface.
A fourth diagram shows what happens when all three torches are turned on at the same time and their beams partially overlap one another. Understanding the diagrams:
A fourth diagram shows what happens when all three torches are turned on at the same time and their beams partially overlap one another. Understanding the diagrams:
- The diagrams illustrate how the RGB colour model works in practice.
- Each torch emits light at the same intensity.
- Each torch points towards a different area of the surface.
- The light in each case is of a single wavelength so produces a spectral colour.
- The selected wavelengths are: red ...
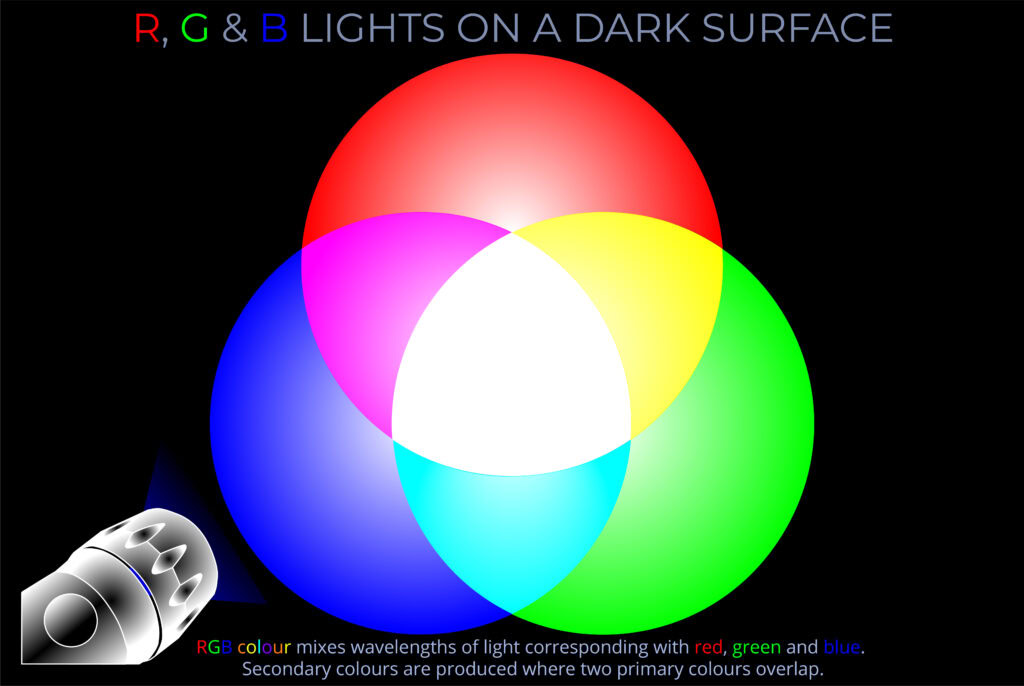
R G & B Lights on a Dark Surface
This diagram shows the effect of projecting red, green and blue light onto a neutral coloured surface.
- Imagine that the three circles of colour (red, green and blue) are produced by three torches shining beams of light so they overlap one another.
- Overlapping pairs of primary colours produce secondary colours.
- Overlapping pairs of secondary colours produce primary colours.
- The area where all three primary colours overlap is white.
- The diagrams illustrate how the RGB colour model works in practice.
- Each torch emits light at the same intensity.
- Each torch points towards a different area ...
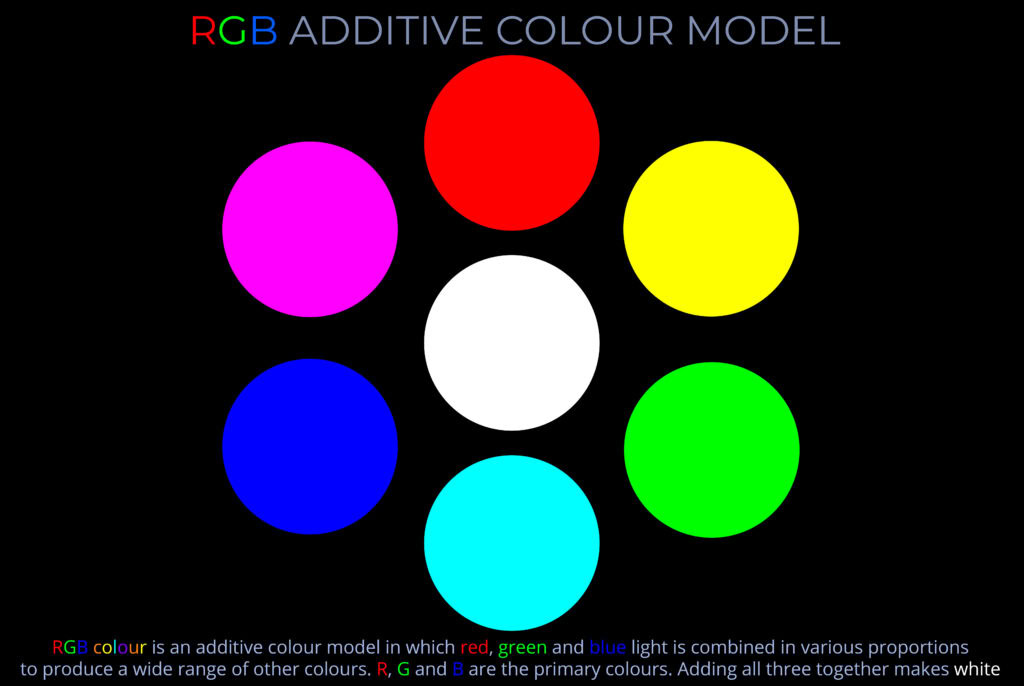
RGB Additive Colour Model
This diagram introduces the RGB colour model. It shows the three primary colours (red, green and blue) with secondary colours between them. What you need to remember:
- Mixing different wavelengths of light to produce other colours, is called an additive colour model or an additive approach to colour.
- Red, green and blue (RGB) are additive primary colours. This means that when these wavelengths of light are projected onto a dark surface they combined to produce other colours. The colour produced depends on the intensity of each light source.
- If wavelengths of light corresponding with all three additive primary ...
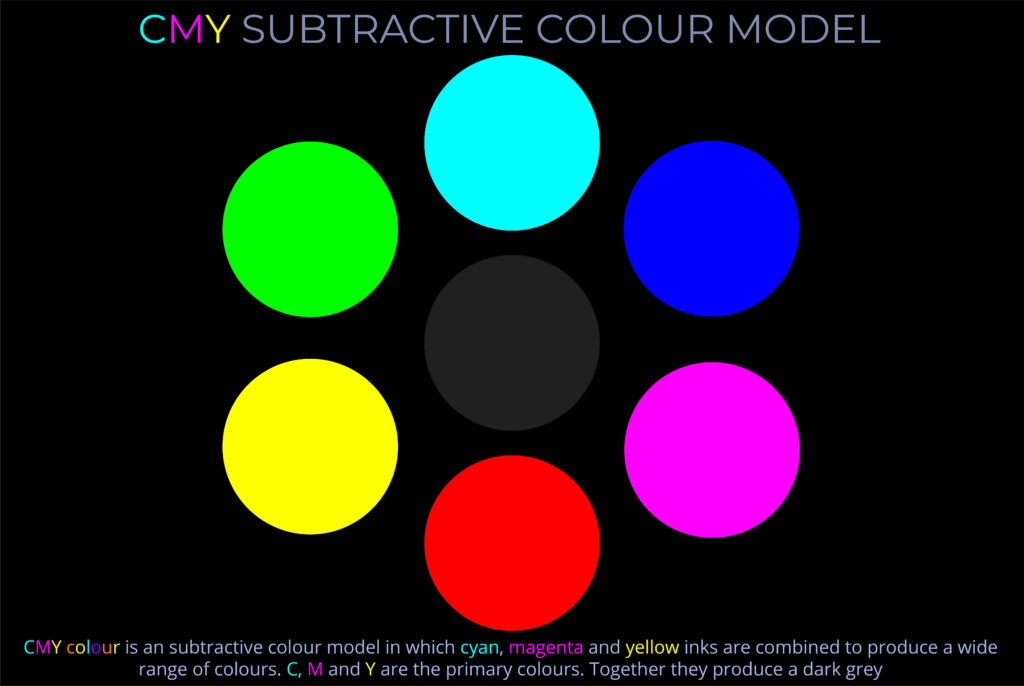
CMY Subtractive Colour Model
This diagram introduces the CMY colour model. It shows the three primary colours (cyan, magenta and blue) with secondary colours between them.
The CMY colour model is a subtractive colour model that predicts the appearance of cyan, magenta and yellow inks when they are mixed together to produce other colours. What you need to remember:
The CMY colour model is a subtractive colour model that predicts the appearance of cyan, magenta and yellow inks when they are mixed together to produce other colours. What you need to remember:
- The CMY colour model is a method for mixing inks used by digital printers to produce other colours. It is called a subtractive colour model (a subtractive approach to colour).
- The name of the CMY colour model comes from the initials of its ...
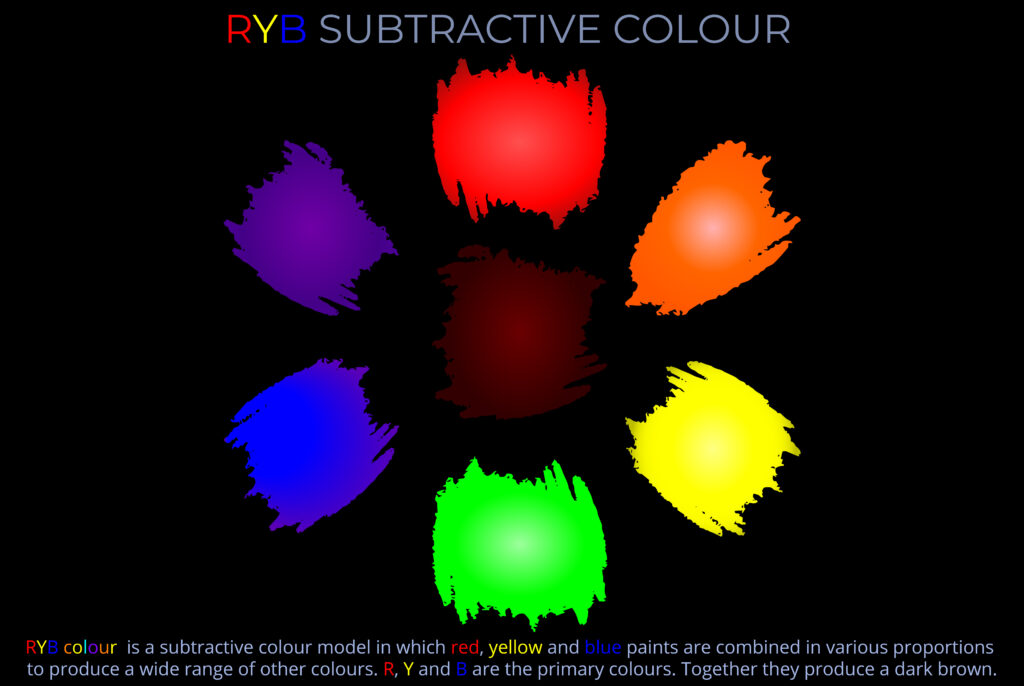
RYB Subtractive Colour Model
This diagram introduces the RYB colour model. It shows the three primary colours (red, yellow and blue) with secondary colours between them.
The RYB colour model is a subtractive colour model that predicts the appearance of red, yellow and blue paints and opaque pigments when they are mixed together to produce other colours. What you need to remember:
The RYB colour model is a subtractive colour model that predicts the appearance of red, yellow and blue paints and opaque pigments when they are mixed together to produce other colours. What you need to remember:
- The RYB colour model is a method for mixing different artists paints and opaque pigments to produce other colours. It is called a subtractive colour model (a subtractive approach to colour).
- The name of the RYB colour model comes from ...
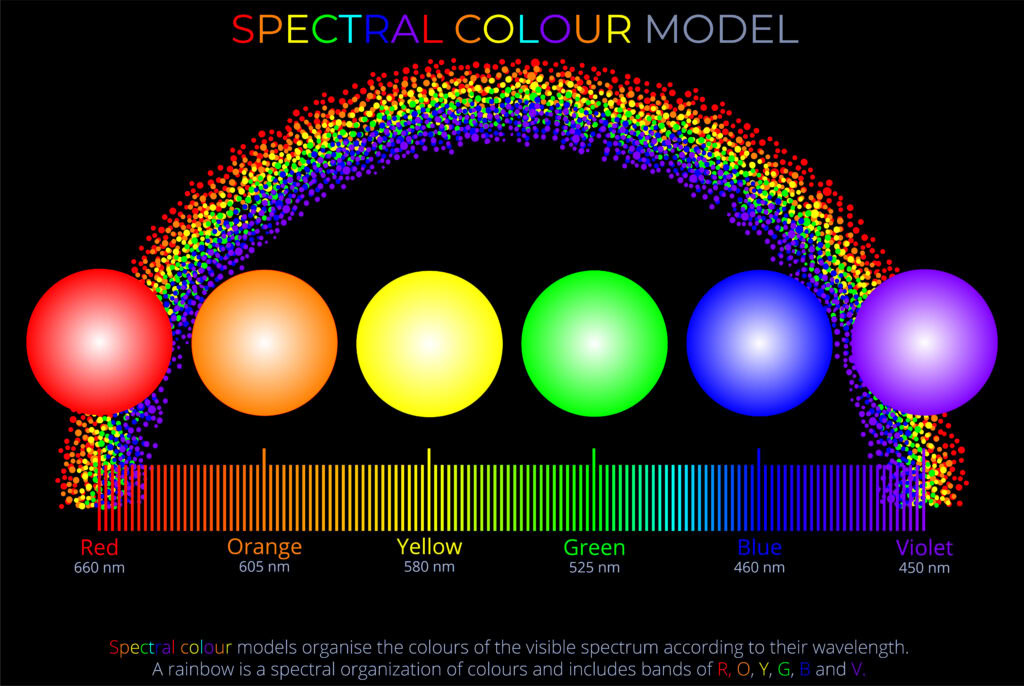
Spectral Colour Model
This diagram introduces the spectral colour model. Spectral colours are the colours of the visible spectrum.
Spectral colours are evoked by a single wavelength of light in the visible spectrum. So, very wavelength of visible light is perceived as a spectral colour by a human observer. The spectral colour model explains why different light sources produce different experiences of colour for an observer. What you need to remember:
Spectral colours are evoked by a single wavelength of light in the visible spectrum. So, very wavelength of visible light is perceived as a spectral colour by a human observer. The spectral colour model explains why different light sources produce different experiences of colour for an observer. What you need to remember:
- A diagram of spectral colour is usually presented in the form of a continuous linear spectrum organised by wavelength, with red at one end and violet at the other.
- The ...
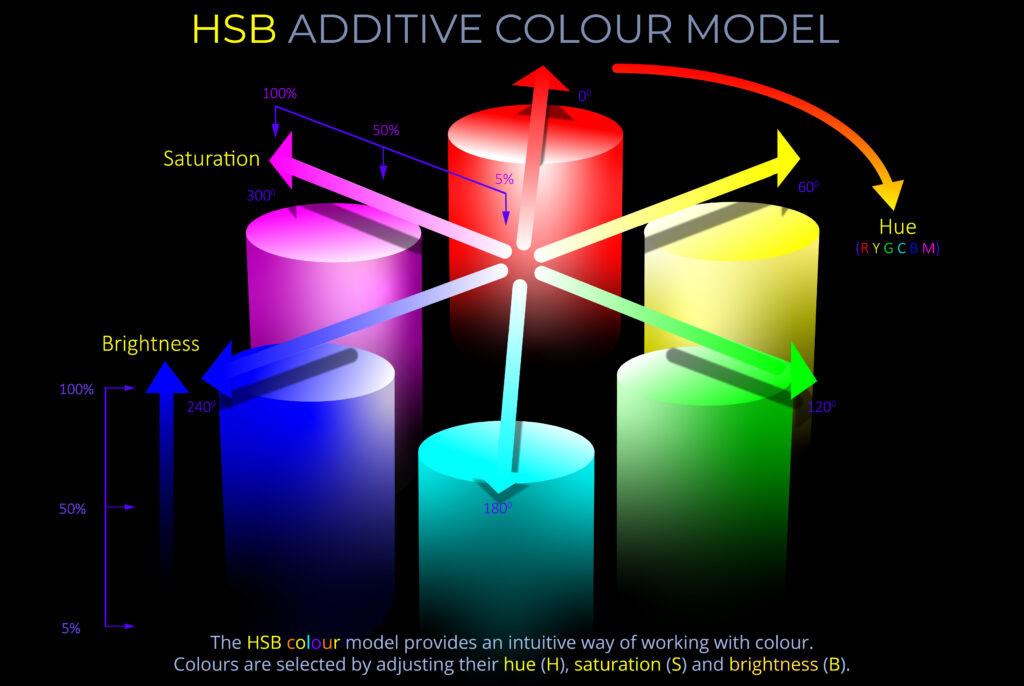
HSB Additive Colour Model
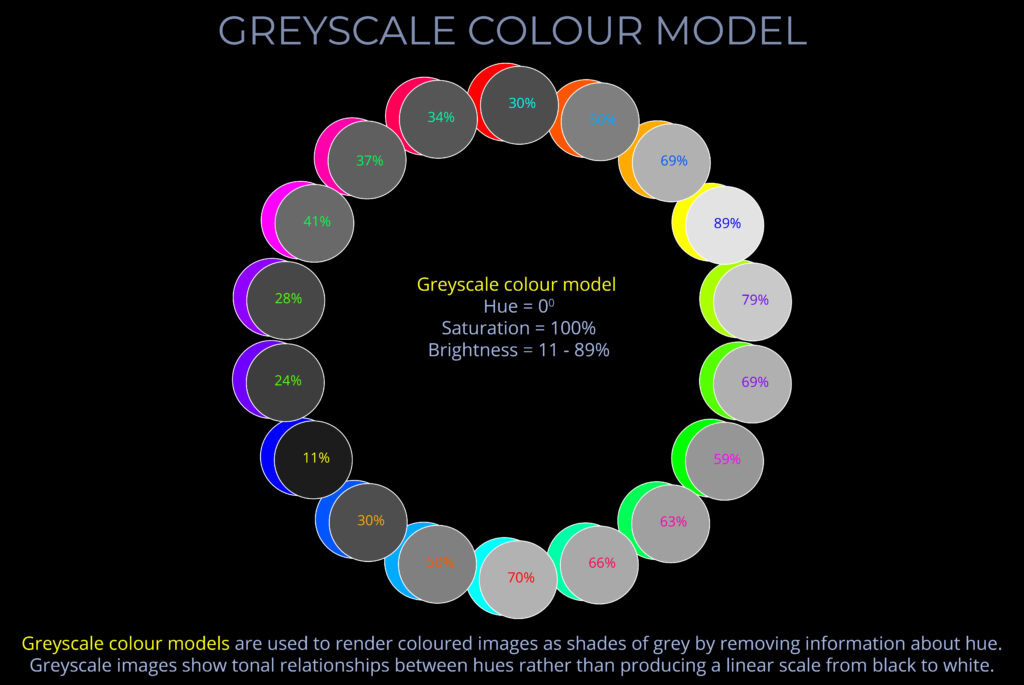
This diagram is a new addition to the site! More information will be added ASAP 🙂 ...
Greyscale Colour Model
This diagram is a new addition to the site! More information will be added ASAP 🙂 ...
Overlapping Beams of R & G Make Yellow
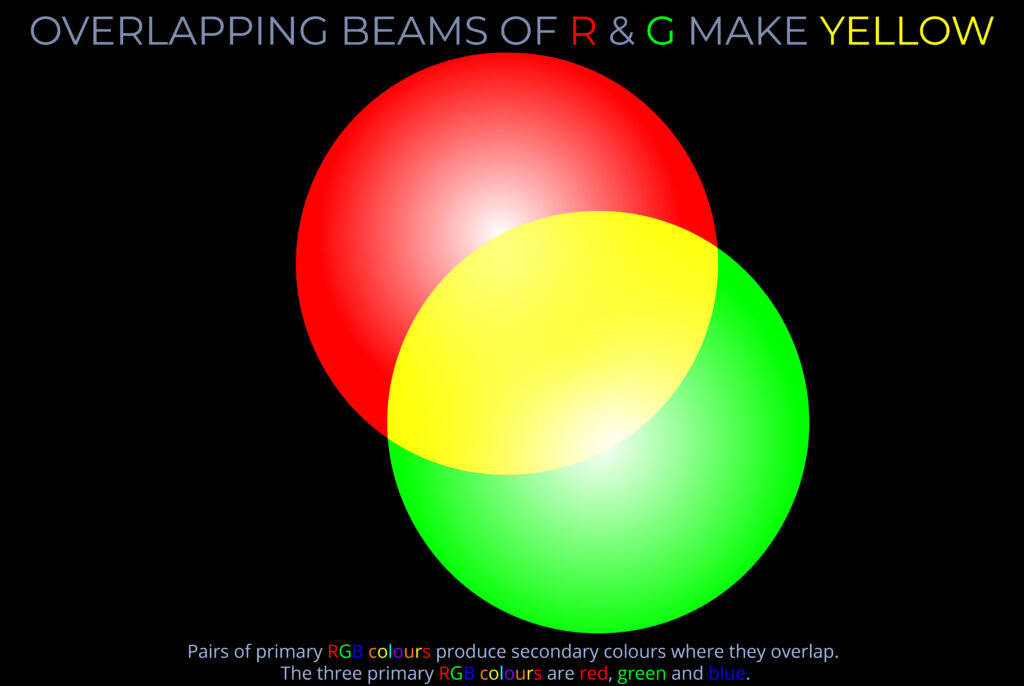
This is one of a set of 3 diagrams showing pairs of RGB primary colours projected onto a neutral coloured surface.
In this diagram red and green primary colours overlap to produce yellow. Understanding the diagrams:
In this diagram red and green primary colours overlap to produce yellow. Understanding the diagrams:
- The diagrams illustrate how the RGB colour model works in practice.
- The two primary colours have the same intensity.
- Each torch points towards a different area of the surface so they overlap.
- The light in each case is of a single wavelength so produces a spectral colour.
- The selected wavelengths are: red = 660 nanometres (nm), green = 525 nm.
Overlapping Beams of G & B Make Cyan
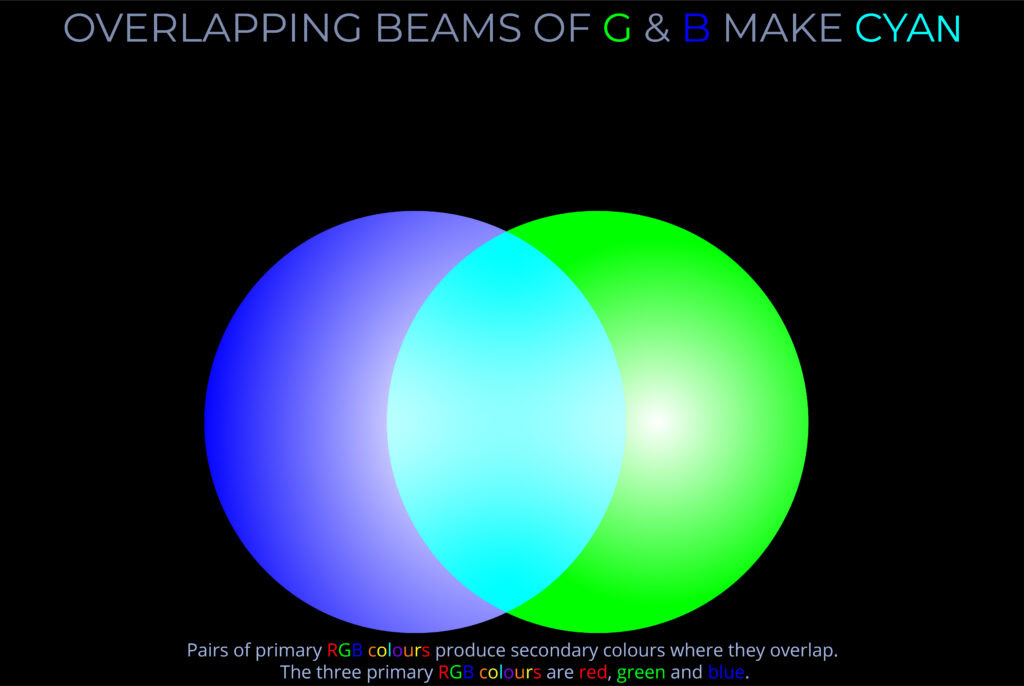
This is one of a set of 3 diagrams showing pairs of RGB primary coloursprojected onto a neutral coloured surface.
In this diagram green and blue primary colours overlap to produce cyan. Understanding the diagrams:
In this diagram green and blue primary colours overlap to produce cyan. Understanding the diagrams:
- The diagrams illustrate how the RGB colour model works in practice.
- The two primary colours have the same intensity.
- Each torch points towards a different area of the surface so they overlap.
- The light in each case is of a single wavelength so produces a spectral colour.
- The selected wavelengths are: green = 525, blue = 460 nm.
Overlapping Beams of B & R Make Magenta
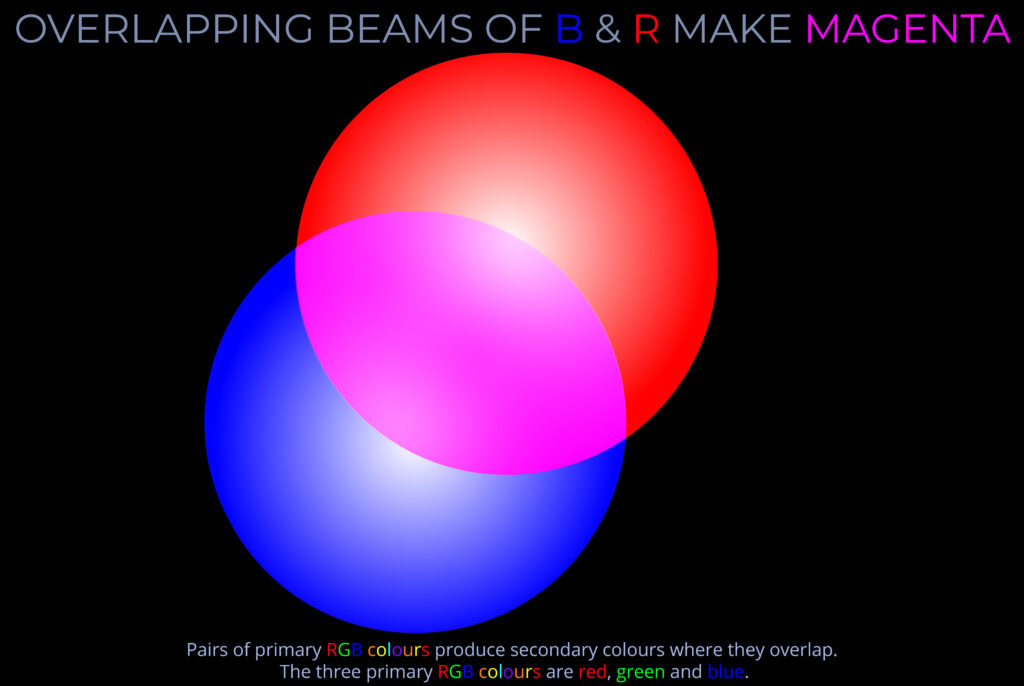
This is one of a set of 3 diagrams showing pairs of RGB primary colours projected onto a neutral coloured surface.
In this diagram blue and red primary colours overlap to produce magenta. Understanding the diagrams:
In this diagram blue and red primary colours overlap to produce magenta. Understanding the diagrams:
- The diagrams illustrate how the RGB colour model works in practice.
- The two primary colours have the same intensity.
- Each torch points towards a different area of the surface so they overlap.
- The light in each case is of a single wavelength so produces a spectral colour.
- The selected wavelengths are: red = 660 nanometres (nm), blue = 460 nm.
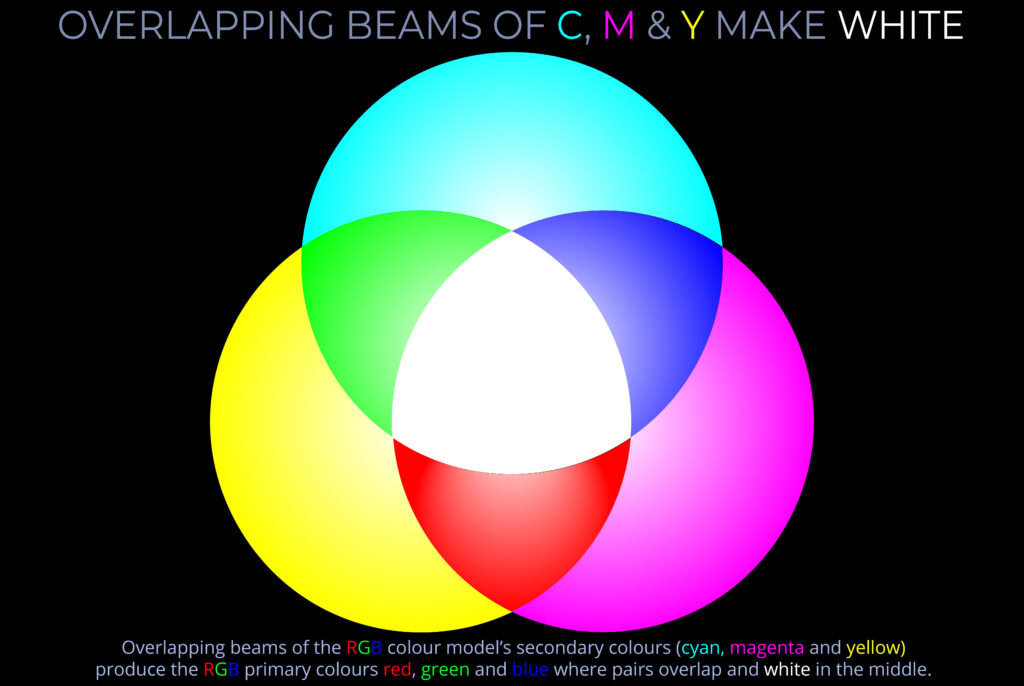
Overlapping Beams of C M & Y Make White
This diagram shows the effect of projecting cyan, magenta and yellow light onto a neutral coloured surface.
- In the RGB colour model, cyan, magenta and yellow are secondary colours. Notice what colours are produced where they overlap!
- Imagine that the three circles of colour (cyan, magenta and yellow) are produced by torches shining beams of light so they overlap one another.
- Overlapping pairs of primary colours produce secondary colours.
- But in this diagram overlapping pairs of secondary colours produce primary colours
- The area where all three primary colours overlap is white.
- The diagrams illustrate ...
Inks & the CMY colour model
This diagram is a new addition to the site! More information will be added ASAP 🙂 ...
Colours Between RGB Primaries
This diagram is a new addition to the site! More information will be added ASAP 🙂 ...
RGB Colour & Spectral Colour
This diagram is a new addition to the site! More information will be added ASAP 🙂 ...
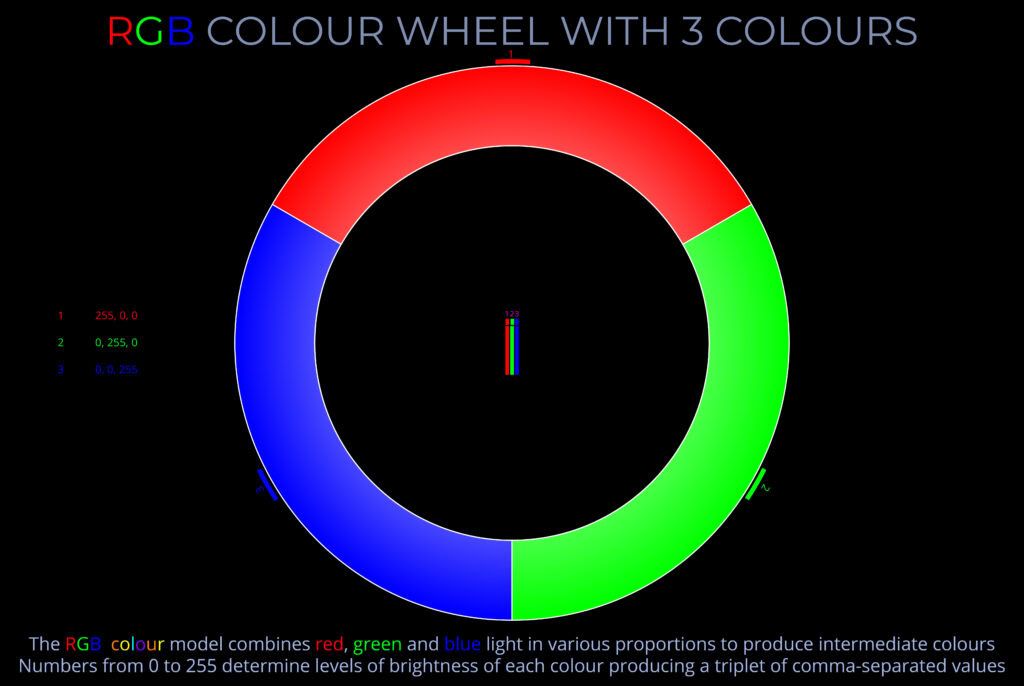
RGB Colour Wheel with 3 Colours – Wheel
This is one of a series of diagrams exploring RGB colour wheels. Colour wheels demonstrate or simulate the effect of colour mixing.
Colour wheels can be used to explore the effect of mixing any type of colour. Light, inks, dyes, artist's paints, pigments and colourants all produce other colours when mixed together. Whilst a colour model outlines a method for mixing and using different types of colour, a colour wheel explores what happens in practice ...
Colour wheels can be used to explore the effect of mixing any type of colour. Light, inks, dyes, artist's paints, pigments and colourants all produce other colours when mixed together. Whilst a colour model outlines a method for mixing and using different types of colour, a colour wheel explores what happens in practice ...
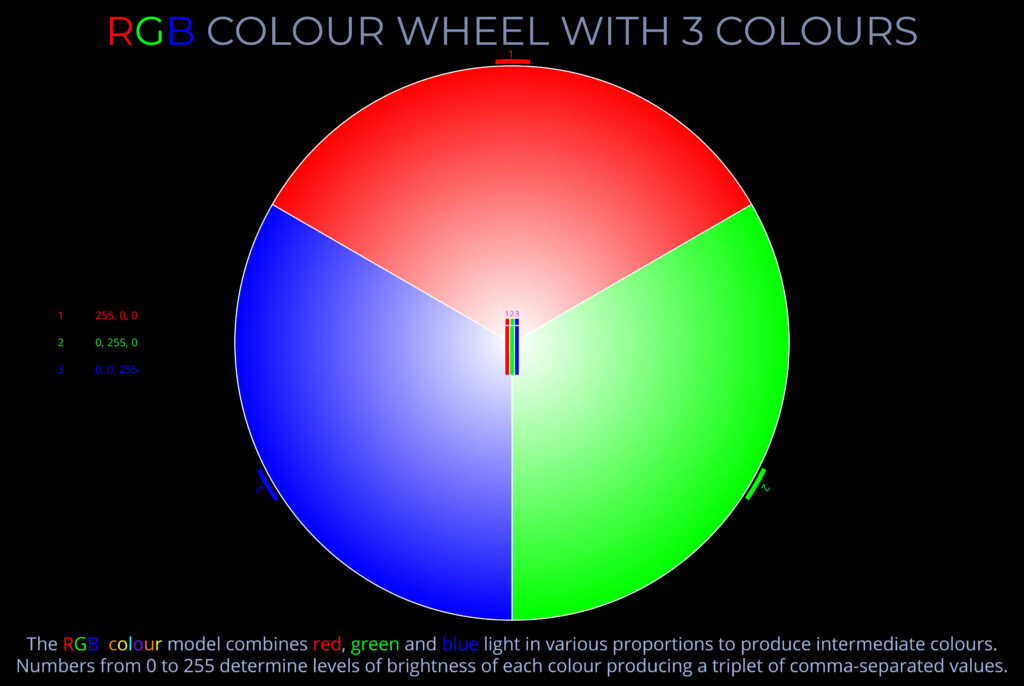
RGB Colour Wheel with 3 Colours – Disc
This is one of a series of diagrams exploring RGB colour wheels. Colour wheels demonstrate or simulate the effect of colour mixing.
Colour wheels can be used to explore the effect of mixing any type of colour. Light, inks, dyes, artist's paints, pigments and colourants all produce other colours when mixed together. Whilst a colour model outlines a method for mixing and using different types of colour, a colour wheel explores what happens in practice ...
Colour wheels can be used to explore the effect of mixing any type of colour. Light, inks, dyes, artist's paints, pigments and colourants all produce other colours when mixed together. Whilst a colour model outlines a method for mixing and using different types of colour, a colour wheel explores what happens in practice ...
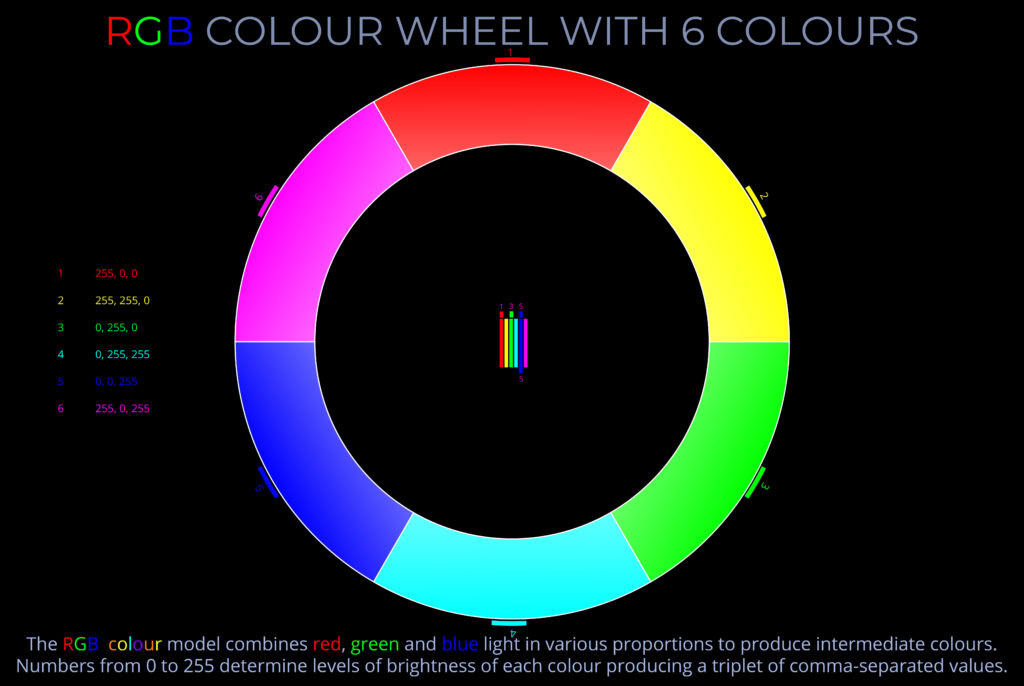
RGB Colour Wheel with 6 Colours – Wheel
This is one of a series of diagrams exploring RGB colour wheels. Colour wheels demonstrate or simulate the effect of colour mixing.
Colour wheels can be used to explore the effect of mixing any type of colour. Light, inks, dyes, artist's paints, pigments and colourants all produce other colours when mixed together. Whilst a colour model outlines a method for mixing and using different types of colour, a colour wheel explores what happens in practice ...
Colour wheels can be used to explore the effect of mixing any type of colour. Light, inks, dyes, artist's paints, pigments and colourants all produce other colours when mixed together. Whilst a colour model outlines a method for mixing and using different types of colour, a colour wheel explores what happens in practice ...
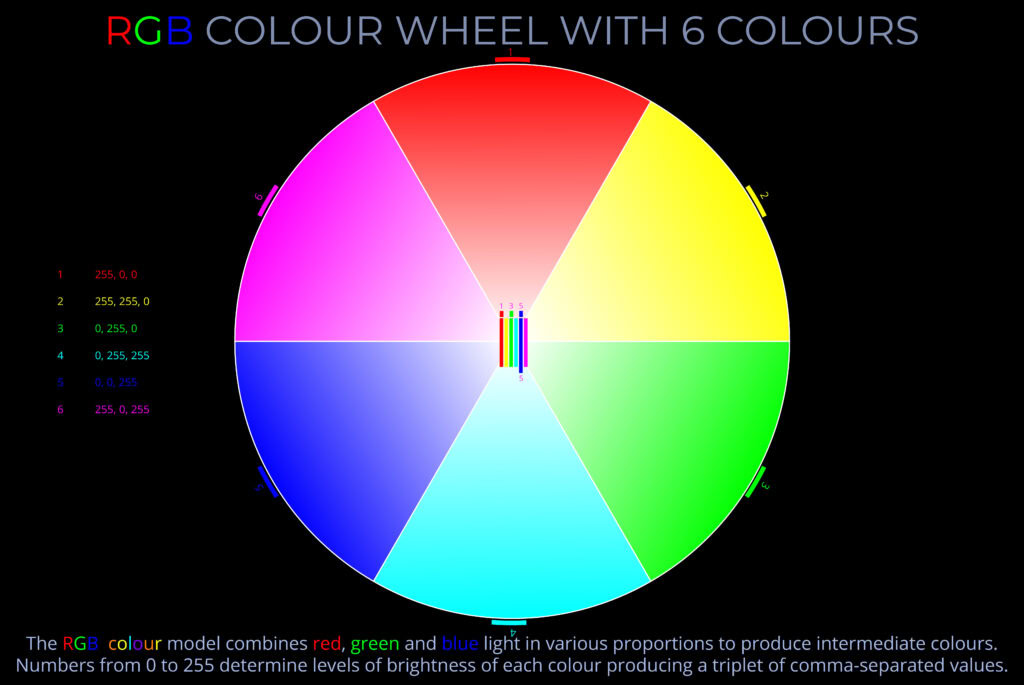
RGB Colour Wheel with 6 Colours – Disc
This is one of a series of diagrams exploring RGB colour wheels. Colour wheels demonstrate or simulate the effect of colour mixing.
Colour wheels can be used to explore the effect of mixing any type of colour. Light, inks, dyes, artist's paints, pigments and colourants all produce other colours when mixed together. Whilst a colour model outlines a method for mixing and using different types of colour, a colour wheel explores what happens in practice ...
Colour wheels can be used to explore the effect of mixing any type of colour. Light, inks, dyes, artist's paints, pigments and colourants all produce other colours when mixed together. Whilst a colour model outlines a method for mixing and using different types of colour, a colour wheel explores what happens in practice ...
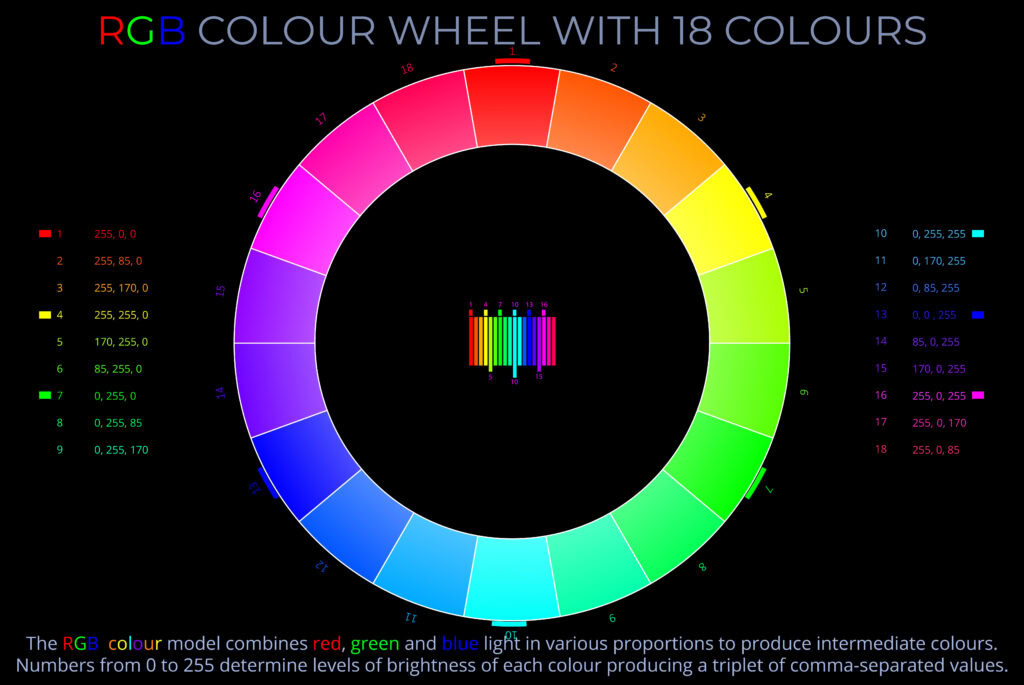
RGB Colour Wheel with 18 Colours – Wheel
This is one of a series of diagrams exploring RGB colour wheels. Colour wheels demonstrate or simulate the effect of colour mixing.
Colour wheels can be used to explore the effect of mixing any type of colour. Light, inks, dyes, artist's paints, pigments and colourants all produce other colours when mixed together. Whilst a colour model outlines a method for mixing and using different types of colour, a colour wheel explores what happens in practice ...
Colour wheels can be used to explore the effect of mixing any type of colour. Light, inks, dyes, artist's paints, pigments and colourants all produce other colours when mixed together. Whilst a colour model outlines a method for mixing and using different types of colour, a colour wheel explores what happens in practice ...
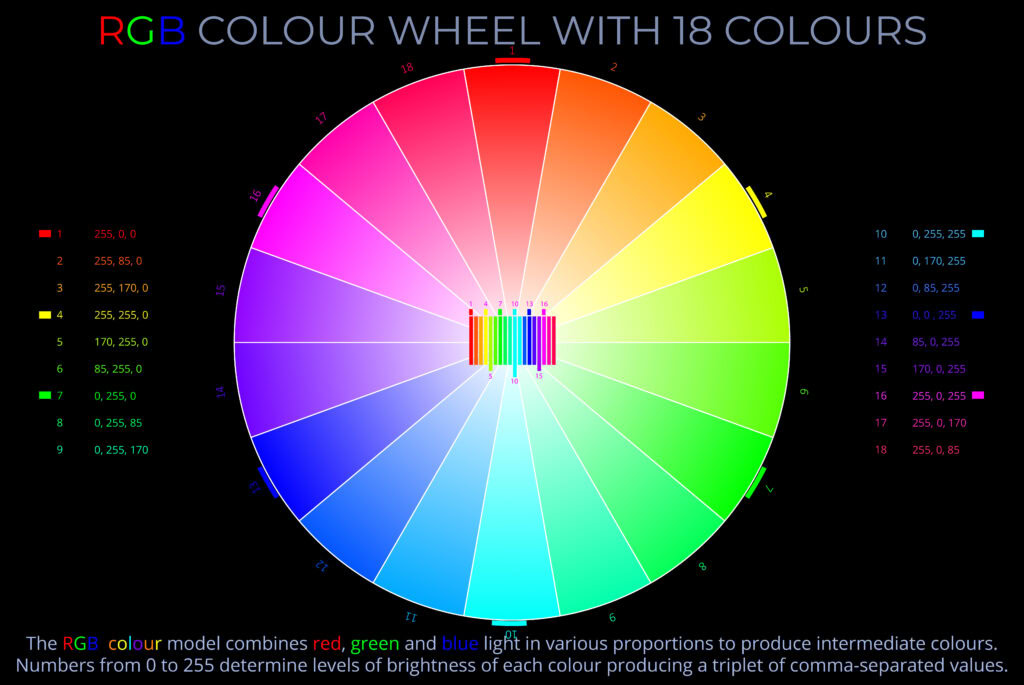
RGB Colour Wheel with 18 Colours – Disc
This is one of a series of diagrams exploring RGB colour wheels. Colour wheels demonstrate or simulate the effect of colour mixing.
Colour wheels can be used to explore the effect of mixing any type of colour. Light, inks, dyes, artist's paints, pigments and colourants all produce other colours when mixed together. Whilst a colour model outlines a method for mixing and using different types of colour, a colour wheel explores what happens in practice ...
Colour wheels can be used to explore the effect of mixing any type of colour. Light, inks, dyes, artist's paints, pigments and colourants all produce other colours when mixed together. Whilst a colour model outlines a method for mixing and using different types of colour, a colour wheel explores what happens in practice ...
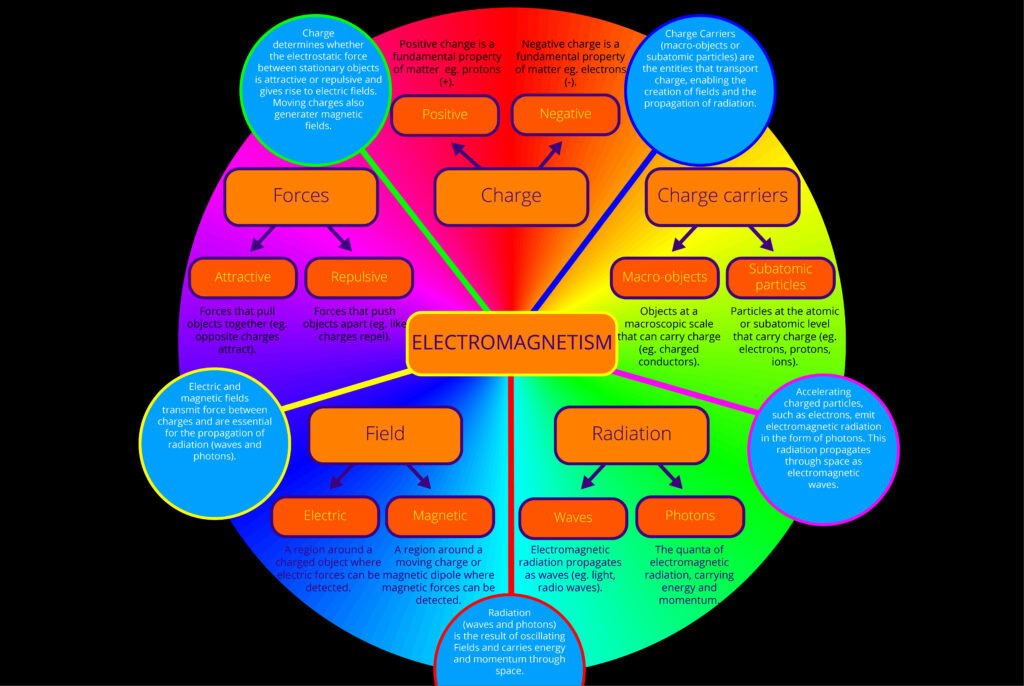
Electromagnetism: Concepts
This is one of a series of diagrams exploring RGB colour wheels. Colour wheels demonstrate or simulate the effect of colour mixing.
Colour wheels can be used to explore the effect of mixing any type of colour. Light, inks, dyes, artist's paints, pigments and colourants all produce other colours when mixed together. Whilst a colour model outlines a method for mixing and using different types of colour, a colour wheel explores what happens in practice ...
Colour wheels can be used to explore the effect of mixing any type of colour. Light, inks, dyes, artist's paints, pigments and colourants all produce other colours when mixed together. Whilst a colour model outlines a method for mixing and using different types of colour, a colour wheel explores what happens in practice ...
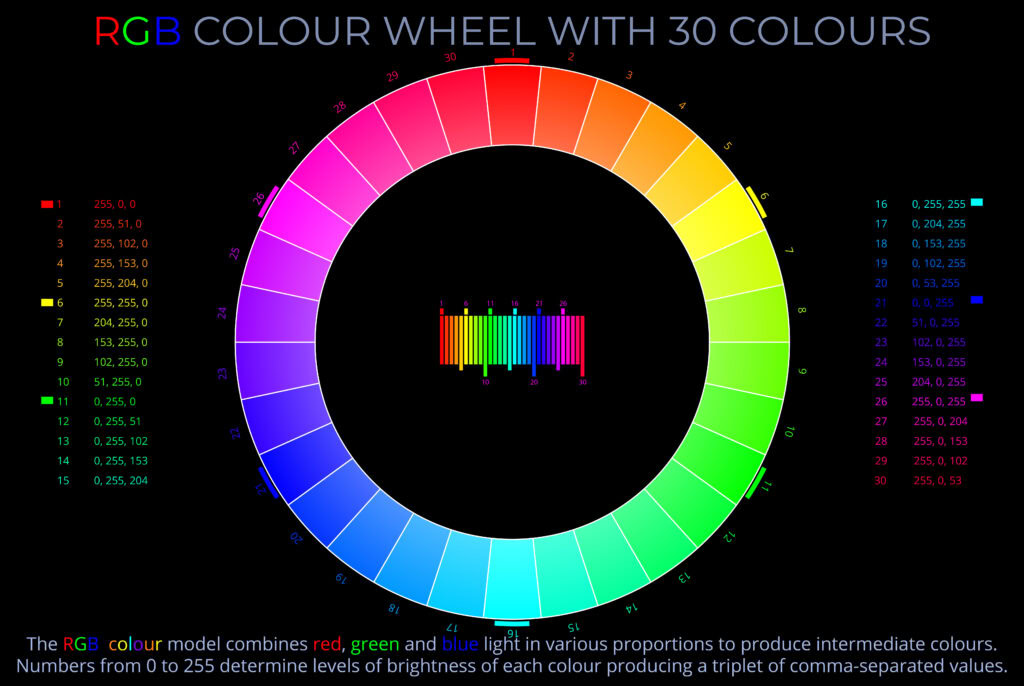
RGB Colour Wheel with 30 Colours – Wheel
This is one of a series of diagrams exploring RGB colour wheels. Colour wheels demonstrate or simulate the effect of colour mixing.
Colour wheels can be used to explore the effect of mixing any type of colour. Light, inks, dyes, artist's paints, pigments and colourants all produce other colours when mixed together. Whilst a colour model outlines a method for mixing and using different types of colour, a colour wheel explores what happens in practice ...
Colour wheels can be used to explore the effect of mixing any type of colour. Light, inks, dyes, artist's paints, pigments and colourants all produce other colours when mixed together. Whilst a colour model outlines a method for mixing and using different types of colour, a colour wheel explores what happens in practice ...
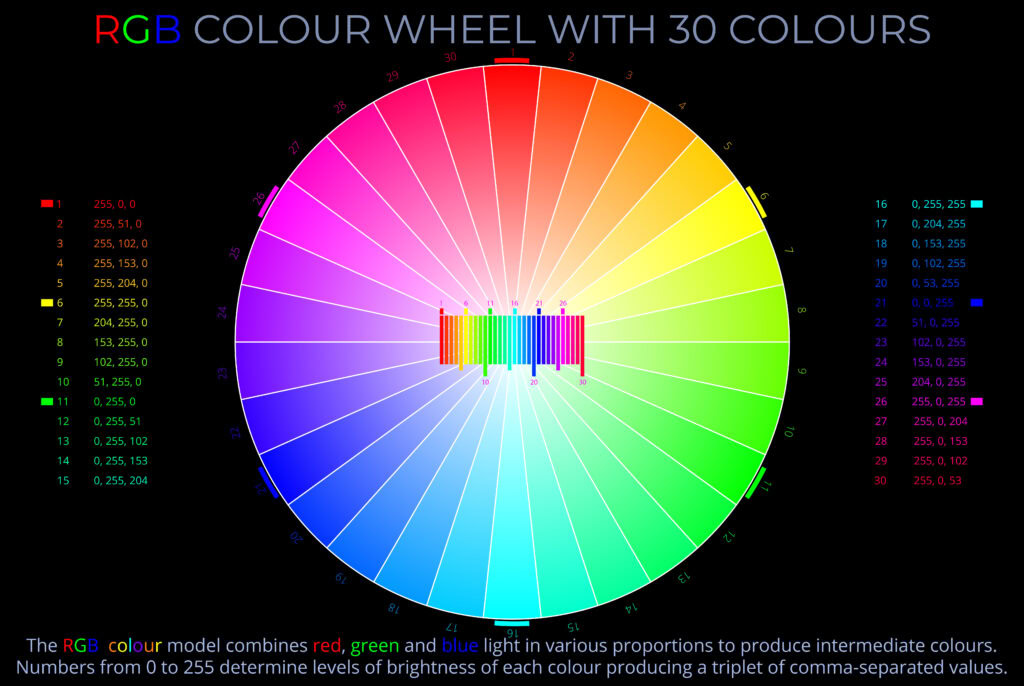
RGB Colour Wheel with 30 Colours – Disc
This is one of a series of diagrams exploring RGB colour wheels. Colour wheels demonstrate or simulate the effect of colour mixing.
Colour wheels can be used to explore the effect of mixing any type of colour. Light, inks, dyes, artist's paints, pigments and colourants all produce other colours when mixed together. Whilst a colour model outlines a method for mixing and using different types of colour, a colour wheel explores what happens in practice ...
Colour wheels can be used to explore the effect of mixing any type of colour. Light, inks, dyes, artist's paints, pigments and colourants all produce other colours when mixed together. Whilst a colour model outlines a method for mixing and using different types of colour, a colour wheel explores what happens in practice ...
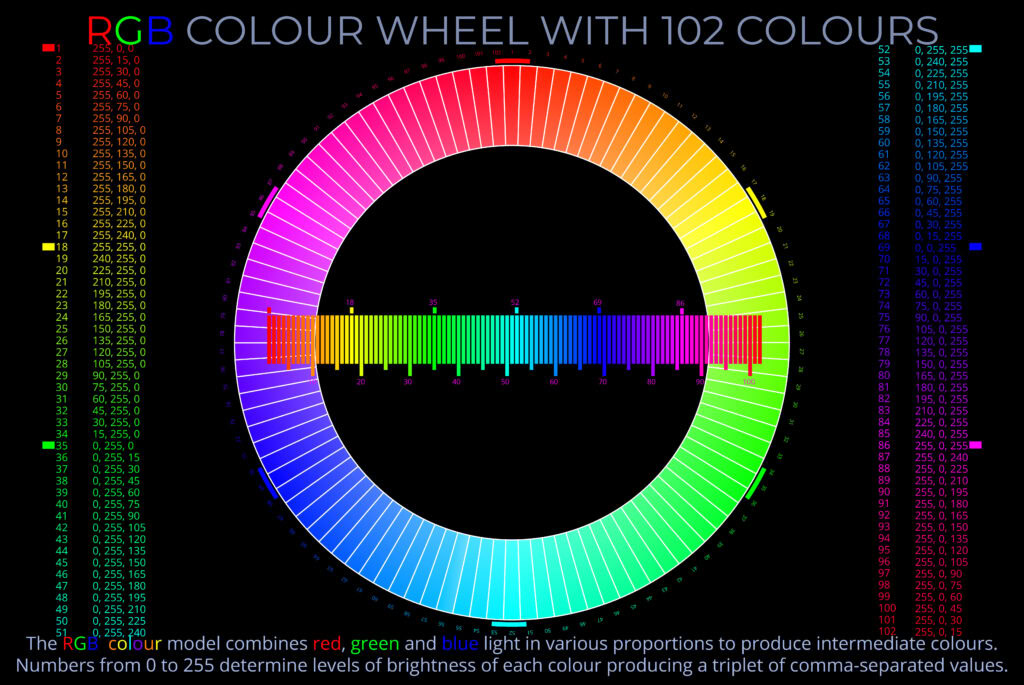
RGB Colour Wheel with 102 Colours – Wheel
This is one of a series of diagrams exploring RGB colour wheels. Colour wheels demonstrate or simulate the effect of colour mixing.
Colour wheels can be used to explore the effect of mixing any type of colour. Light, inks, dyes, artist's paints, pigments and colourants all produce other colours when mixed together. Whilst a colour model outlines a method for mixing and using different types of colour, a colour wheel explores what happens in practice ...
Colour wheels can be used to explore the effect of mixing any type of colour. Light, inks, dyes, artist's paints, pigments and colourants all produce other colours when mixed together. Whilst a colour model outlines a method for mixing and using different types of colour, a colour wheel explores what happens in practice ...
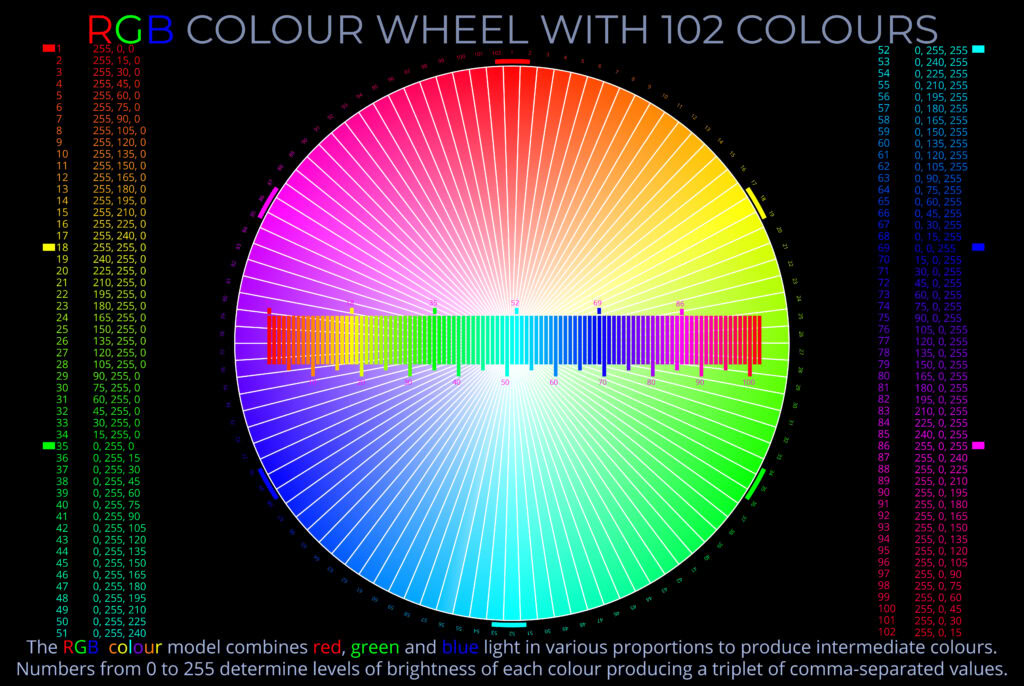
RGB Colour Wheel with 102 Colours – Disc
This is one of a series of diagrams exploring RGB colour wheels. Colour wheels demonstrate or simulate the effect of colour mixing.
Colour wheels can be used to explore the effect of mixing any type of colour. Light, inks, dyes, artist's paints, pigments and colourants all produce other colours when mixed together. Whilst a colour model outlines a method for mixing and using different types of colour, a colour wheel explores what happens in practice ...
Colour wheels can be used to explore the effect of mixing any type of colour. Light, inks, dyes, artist's paints, pigments and colourants all produce other colours when mixed together. Whilst a colour model outlines a method for mixing and using different types of colour, a colour wheel explores what happens in practice ...
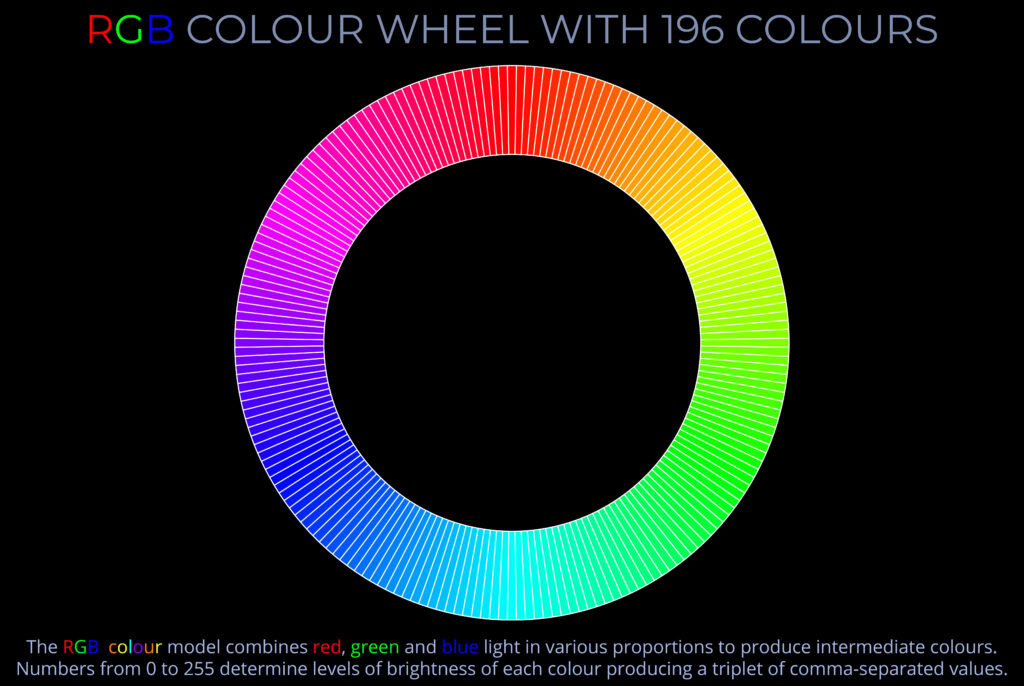
RGB Colour Wheel with 196 Colours – Wheel
This is one of a series of diagrams exploring RGB colour wheels. Colour wheels demonstrate or simulate the effect of colour mixing.
Colour wheels can be used to explore the effect of mixing any type of colour. Light, inks, dyes, artist's paints, pigments and colourants all produce other colours when mixed together. Whilst a colour model outlines a method for mixing and using different types of colour, a colour wheel explores what happens in practice ...
Colour wheels can be used to explore the effect of mixing any type of colour. Light, inks, dyes, artist's paints, pigments and colourants all produce other colours when mixed together. Whilst a colour model outlines a method for mixing and using different types of colour, a colour wheel explores what happens in practice ...
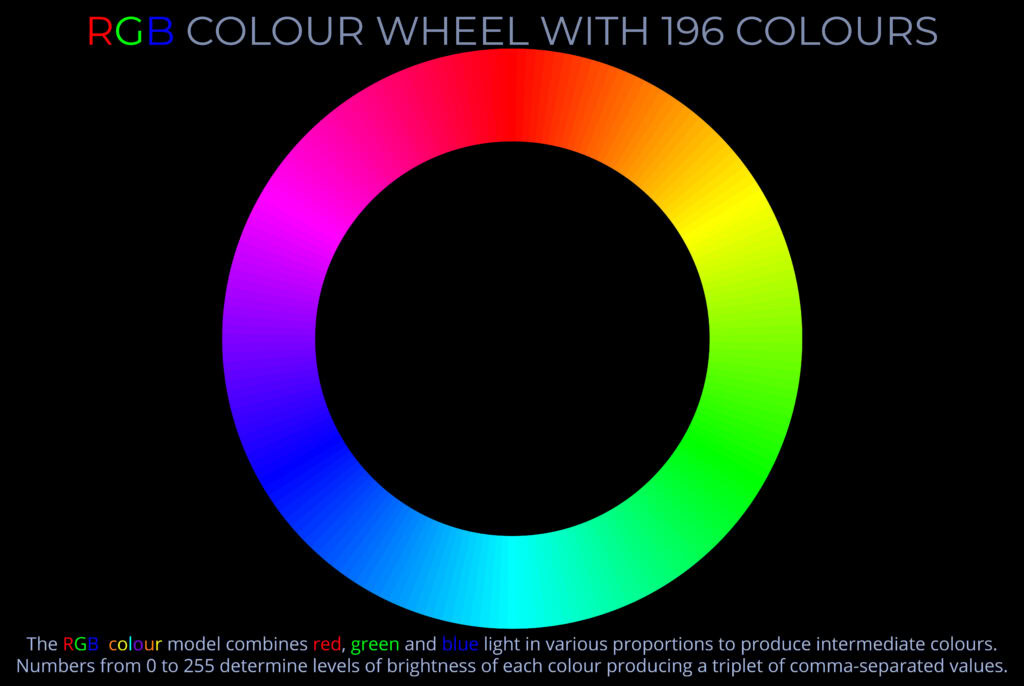
RGB Colour Wheel with 196 Colours – Continuous
This is one of a series of diagrams exploring RGB colour wheels. Colour wheels demonstrate or simulate the effect of colour mixing.
Colour wheels can be used to explore the effect of mixing any type of colour. Light, inks, dyes, artist's paints, pigments and colourants all produce other colours when mixed together. Whilst a colour model outlines a method for mixing and using different types of colour, a colour wheel explores what happens in practice ...
Colour wheels can be used to explore the effect of mixing any type of colour. Light, inks, dyes, artist's paints, pigments and colourants all produce other colours when mixed together. Whilst a colour model outlines a method for mixing and using different types of colour, a colour wheel explores what happens in practice ...
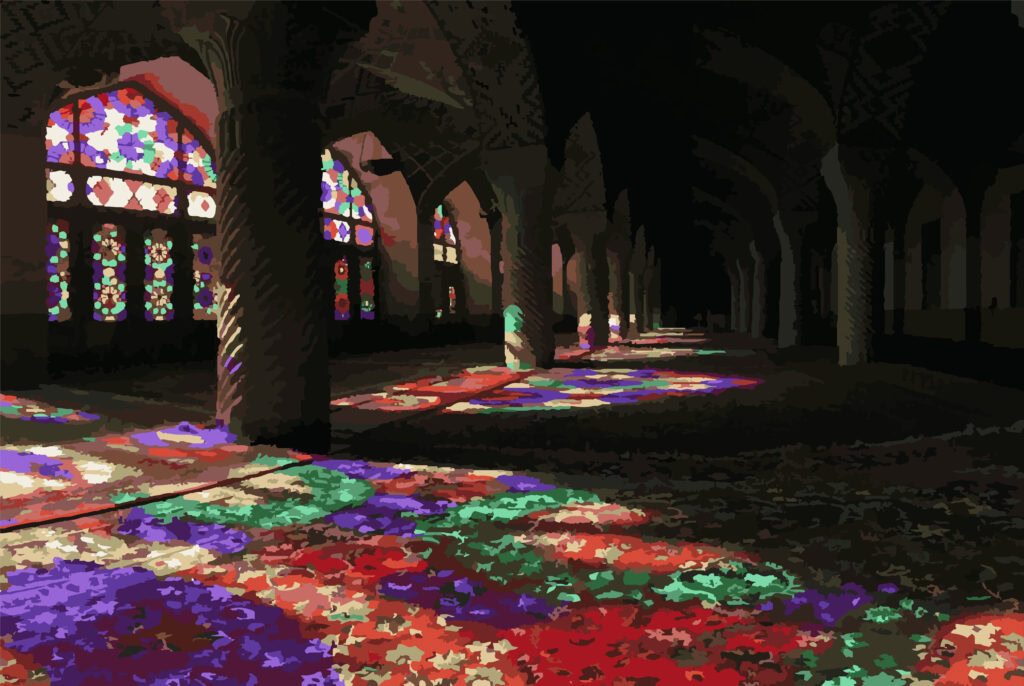
Reflection Refraction & Dispersion – An Introduction
Here are all the diagrams in our Introduction to Reflection, Refraction and Dispersion series. Each one appears on its own page with a full explanation. AND Did you know that all our diagrams are free to download!
...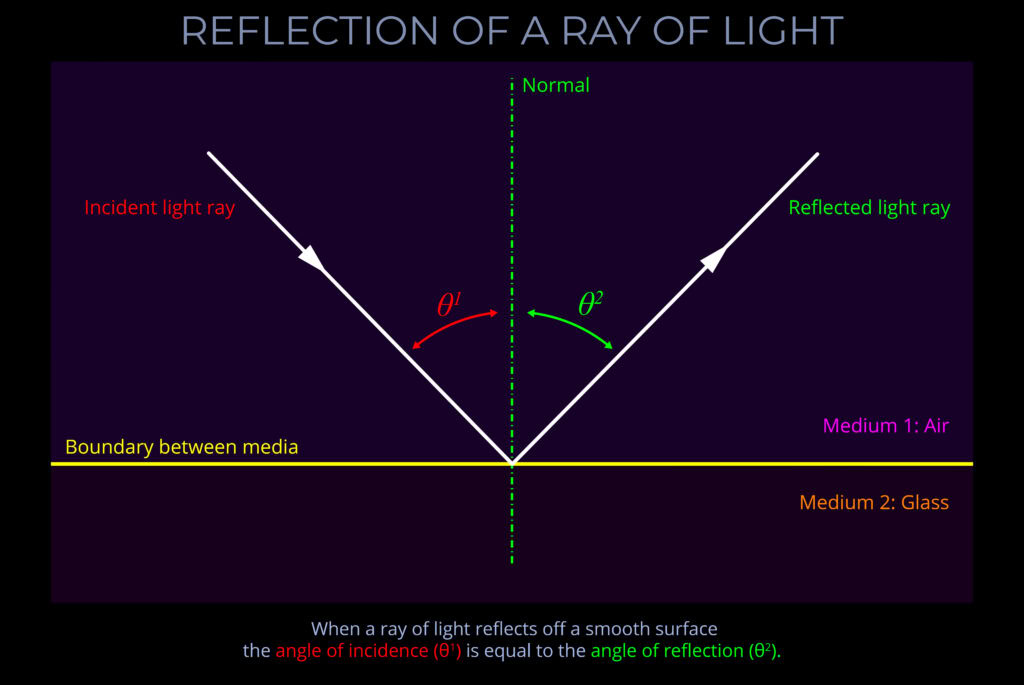
Reflection of a Ray of Light
The diagram shows an incident ray of light approaching the boundary between air and glass.
- When the ray strikes the boundary between air and glass it bounces off the surface of the glass because it is highly reflective.
- The diagram demonstrates that the angle of incidence and angle of reflection are the same.
- The angles of incidence and reflection are both measured between the ray and the normal (the dotted green line).
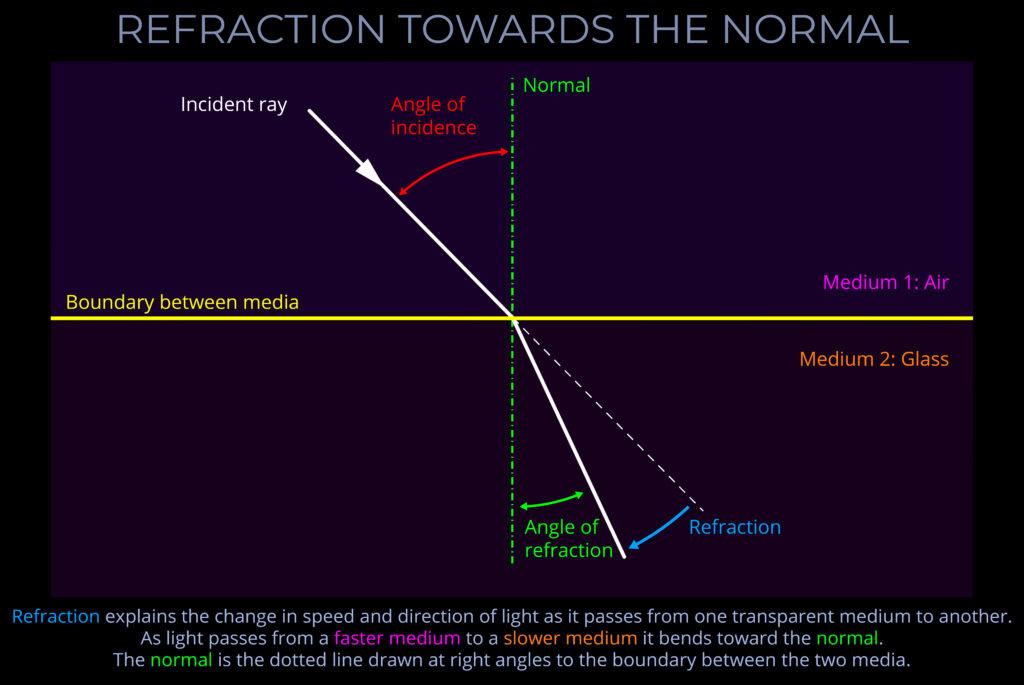
Refraction Towards the Normal
The diagram shows an incident ray of white light approaching the boundary between air and glass.
- As the ray crosses the boundary and encounters the glass it bends towards the normal (the dotted green line).
- The incident ray of light is refracted towards the normal because the ray travels from air, the faster, less optically dense medium with a lower refractive index into the glass, a slower, more optically dense medium with the higher refractive index.
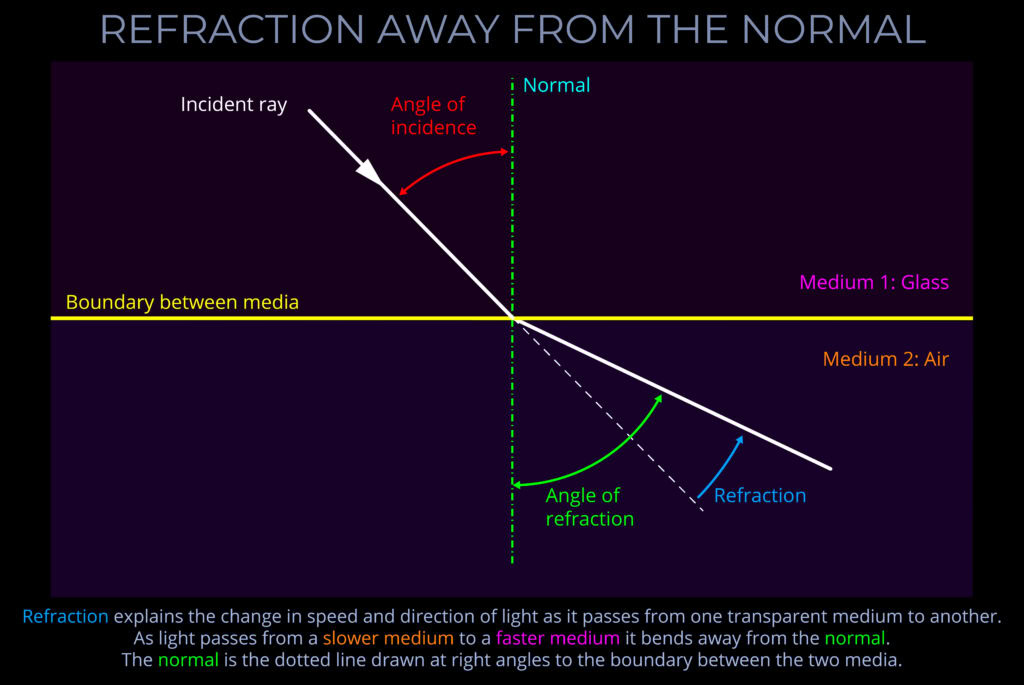
Refraction Away from the Normal
The diagram shows an incident ray of white light approaching the boundary between air and glass.
- As the ray travels through the glass and then crosses the boundary and encounters air it bends away from the normal (the dotted green line).
- The incident ray of light is refracted away from the normal because the ray travels from glass, the slower, more optically dense medium with a higher refractive index into the air, a faster, less optically dense medium with a lower refractive index.
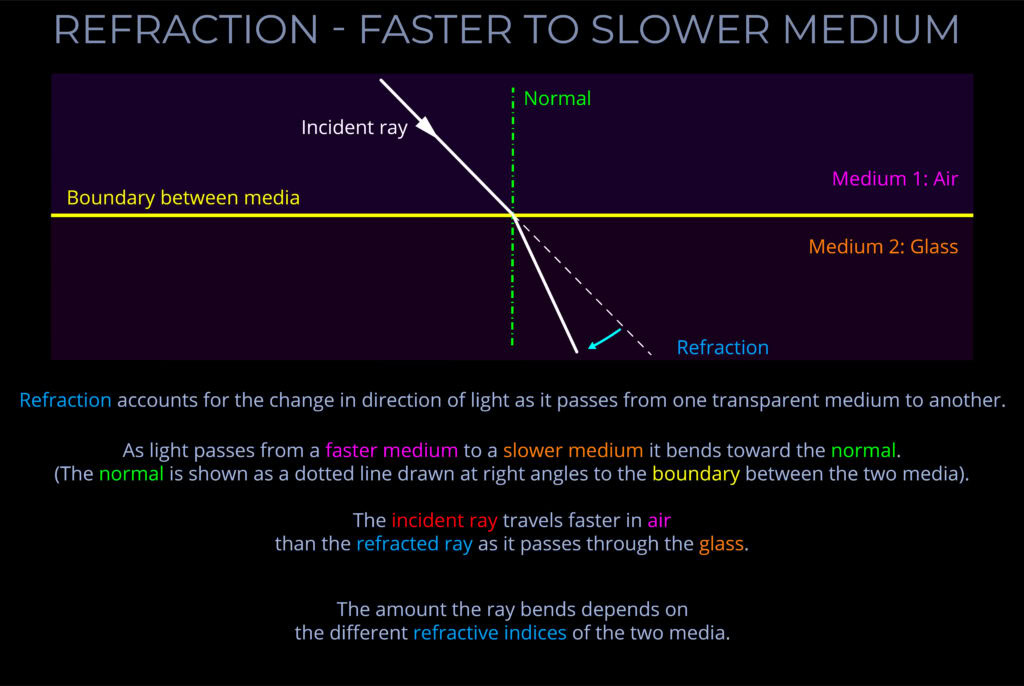
Refraction – Faster to Slower medium
The diagram shows an incident ray of white light approaching the boundary between air and glass.
- As the ray crosses the boundary and encounters the glass it bends towards the normal (the dotted green line).
- The incident ray of light is refracted towards the normal because the ray travels from air, the faster, less optically dense medium with a lower refractive index into the glass, a slower, more optically dense medium with the higher refractive index.
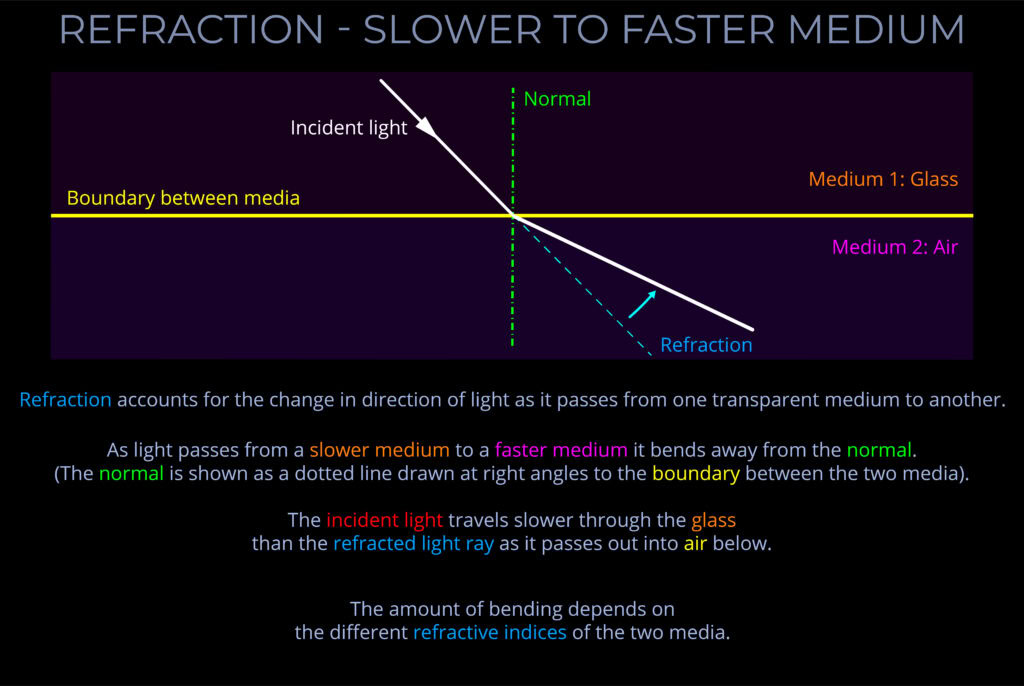
Refraction – Slower to Faster Medium
The diagram shows an incident ray of white light approaching the boundary between air and glass.
- As the ray travels through the glass and then crosses the boundary and encounters air it bends away from the normal (the dotted green line).
- The incident ray of light is refracted away from the normal because the ray travels from glass, the slower, more optically dense medium with a higher refractive index into the air, a faster, less optically dense medium with a lower refractive index.
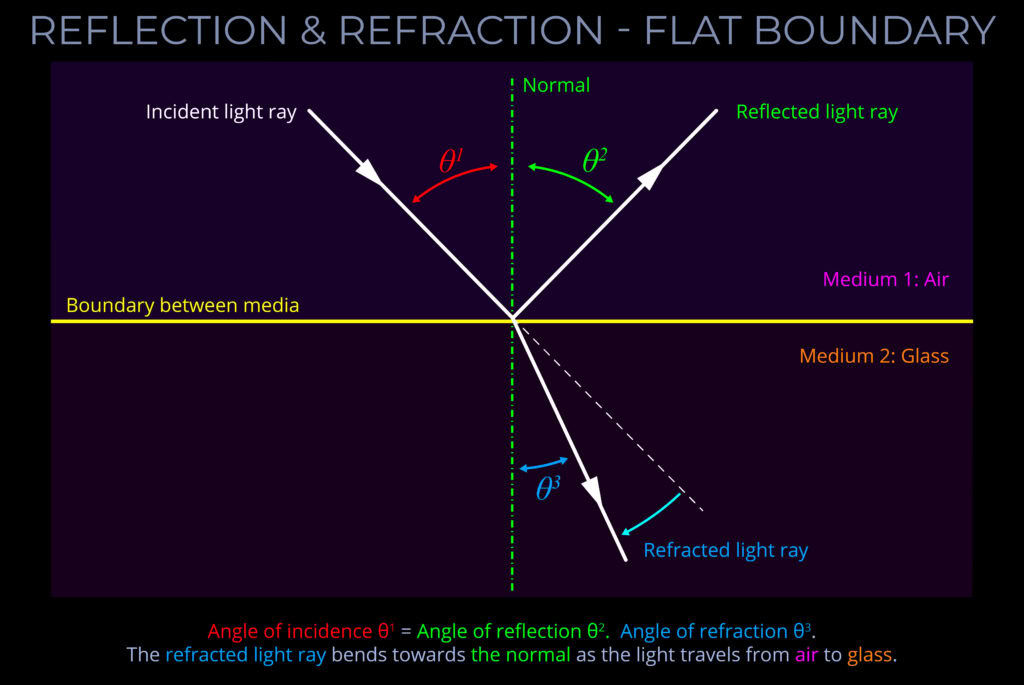
Reflection & Refraction – Flat Boundary
The diagram shows an incident ray of light approaching the boundary between air and glass.
- When the ray strikes the boundary between air and glass some of the light bounces off the surface of the glass because it is highly reflective.
- The diagram demonstrates that the angle of incidence and angle of reflection are the same.
- The angles of incidence and reflection are both measured between the ray and the normal (the dotted green line).
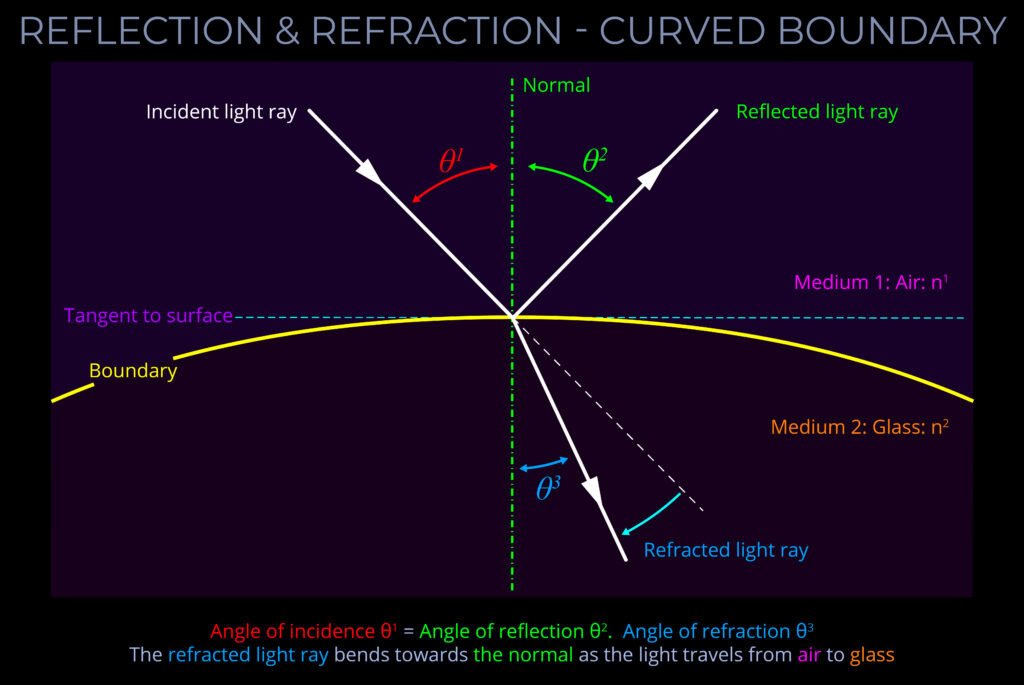
Reflection & Refraction – Curved Boundary
The diagram shows an incident ray of light approaching the boundary between air and glass.
- When the ray strikes the boundary between air and glass some of the light bounces off the surface of the glass because it is highly reflective.
- The diagram demonstrates that the angle of incidence and angle of reflection are the same.
- The angles of incidence and reflection are both measured between the ray and the normal (the dotted green line).
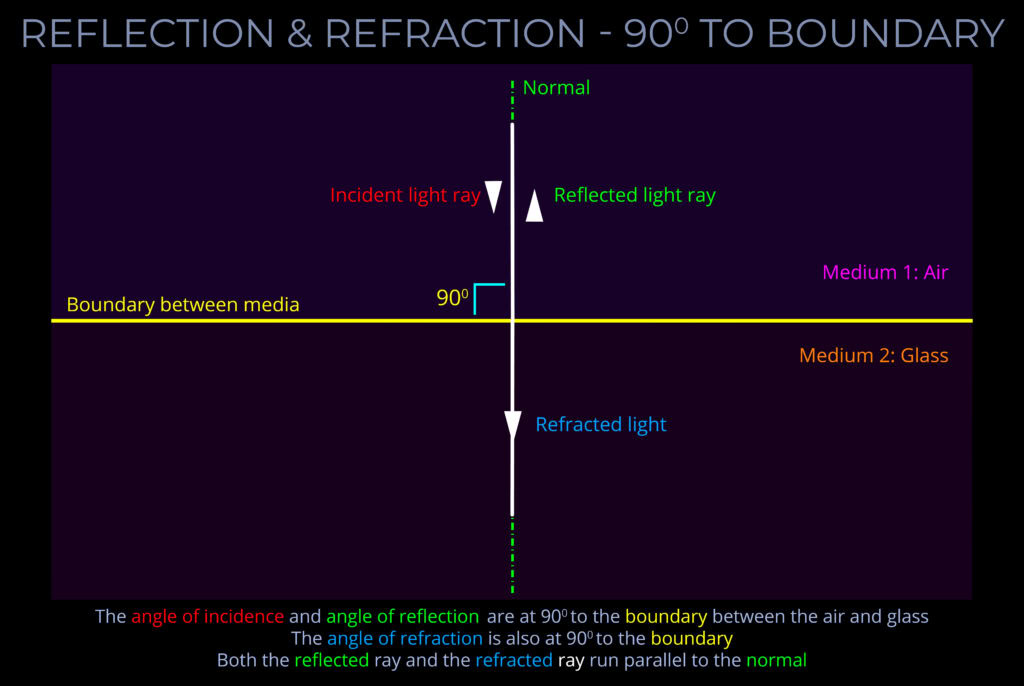
Reflection & Refraction – 90 deg to Boundary
The diagram shows an incident ray of light approaching the boundary between air and glass.
- When the ray strikes the boundary between air and glass partial reflection and partial refraction takes place. This means that a proportion of the light bounces off the surface of the glass and returns into the air whilst the rest undergoes refraction.
- In this diagram, the incident ray of light approaches the boundary between air and glass at an angle of incidence is 00.
- The reflected ray bounces off the surface in line with the incident ray, at a 00 angle to the normal.
- The refracted ...
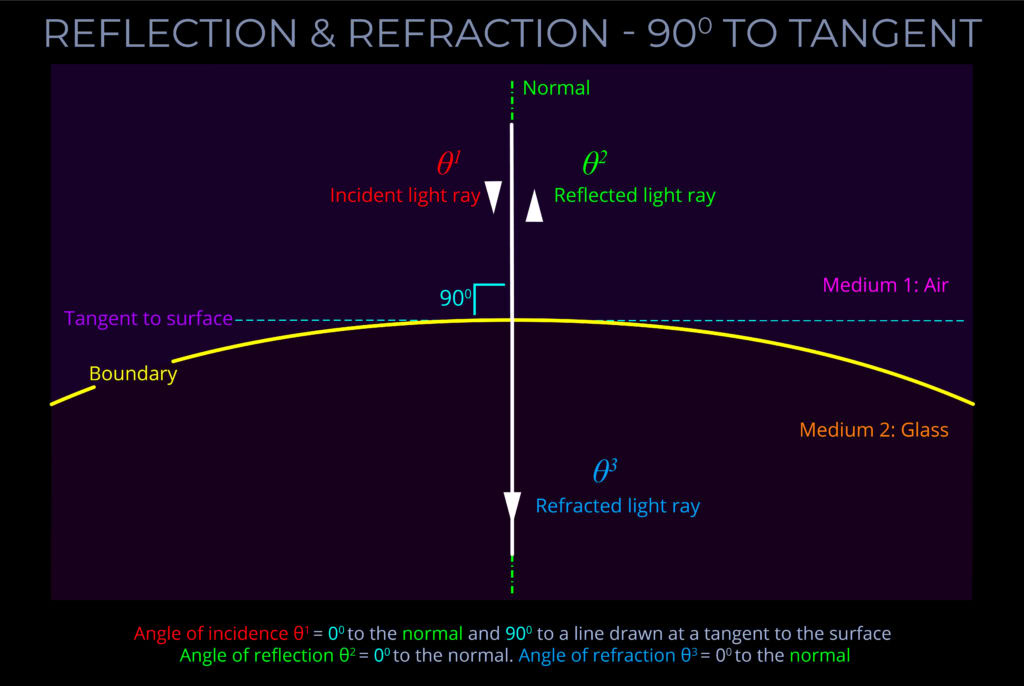
Reflection & Refraction – 90 deg to Tangent
The diagram shows an incident ray of light approaching the boundary between air and glass.
- When the ray strikes the boundary between air and glass some of the light bounces off the surface of the glass because it is highly reflective.
- The diagram demonstrates that the angle of incidence and angle of reflection are the same.
- The angles of incidence and reflection are both measured between the ray and the normal (the dotted green line).
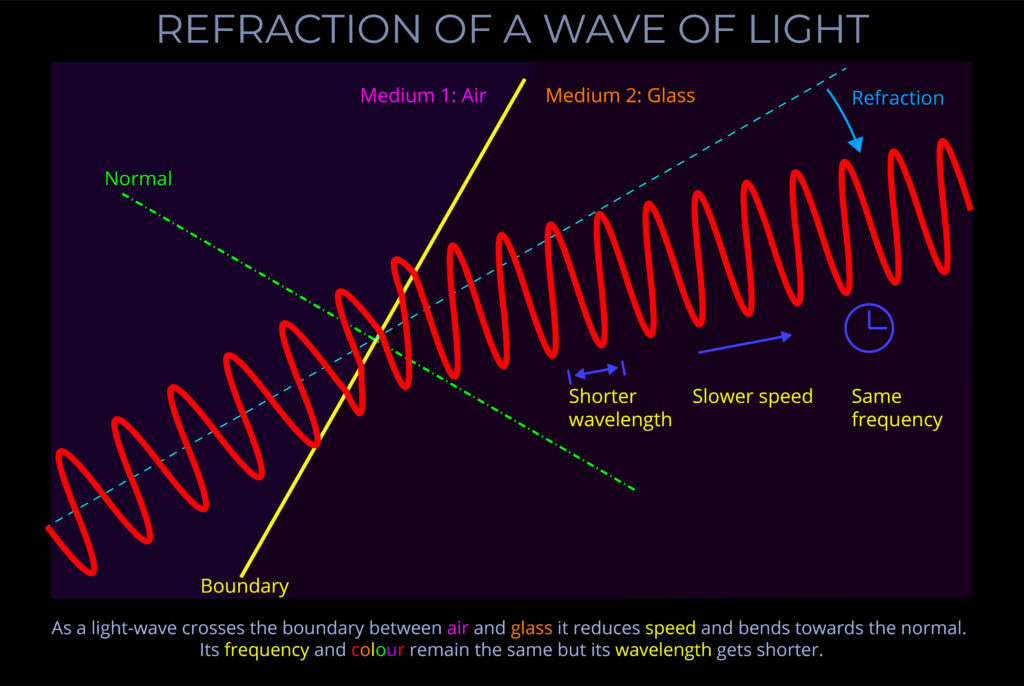
Refraction of a Wave of Light
The diagram shows an incident wave of light with a wavelength corresponding with red approaching the boundary between air and glass.
- As the wave crosses the boundary into the glass it bends towards the normal (the dotted green line).
- Refraction is towards the normal because the ray travels from air, the faster, less optically dense medium with a smaller refractive index into the glass, a slower, more optically dense medium with a higher refractive index.
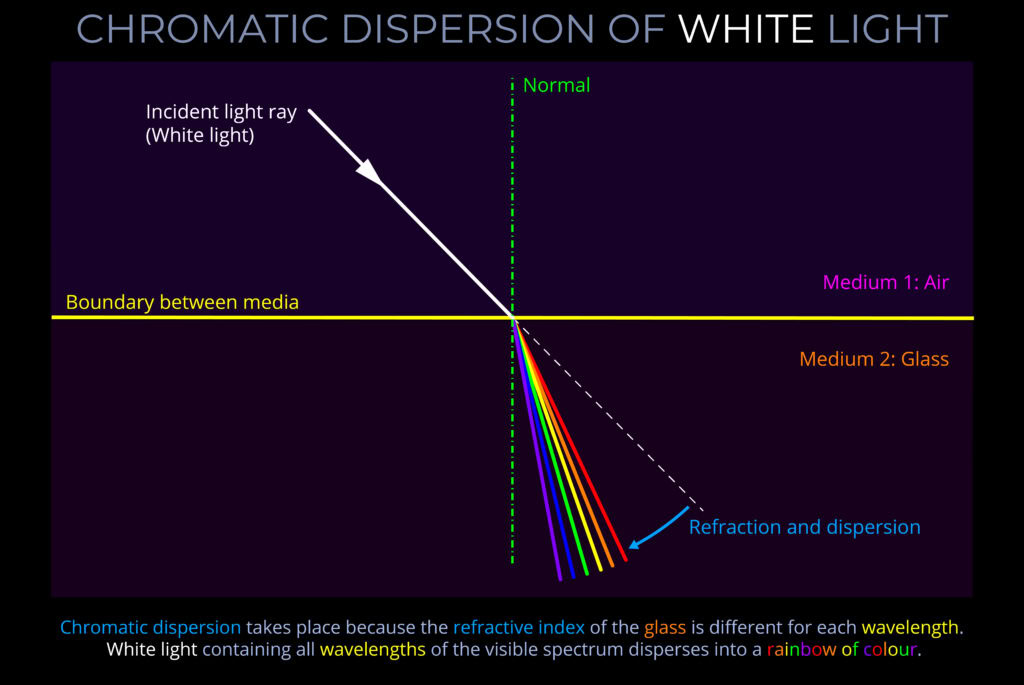
Chromatic Dispersion of White Light
The diagram shows an incident ray of white light approaching the boundary between air and glass.
- As the ray crosses the boundary into the glass it bends towards the normal (the dotted green line).
- The incident ray of light is refracted towards the normal because the ray travels from air, the faster, less optically dense medium with a smaller refractive index into the glass, a slower, more optically dense medium with the higher refractive index.
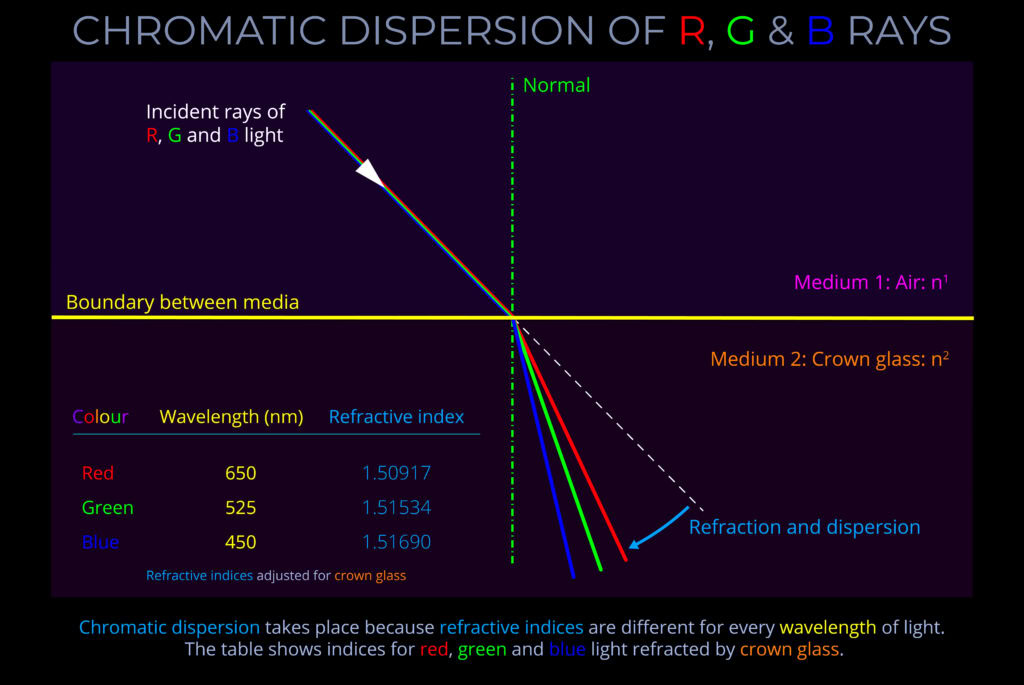
Chromatic Dispersion of R G & B Rays
The diagram shows an incident ray of white light composed of wavelengths corresponding with red, green and blue wavelengths approaching the boundary between air and glass.
- As the ray crosses the boundary into the glass each wavelength bends towards the normal (the dotted green line) by a different amount.
- The incident ray of light is refracted towards the normal because the ray travels from air, the faster, less optically dense medium with a smaller refractive index into the glass, a slower, more optically dense medium with the higher refractive index.
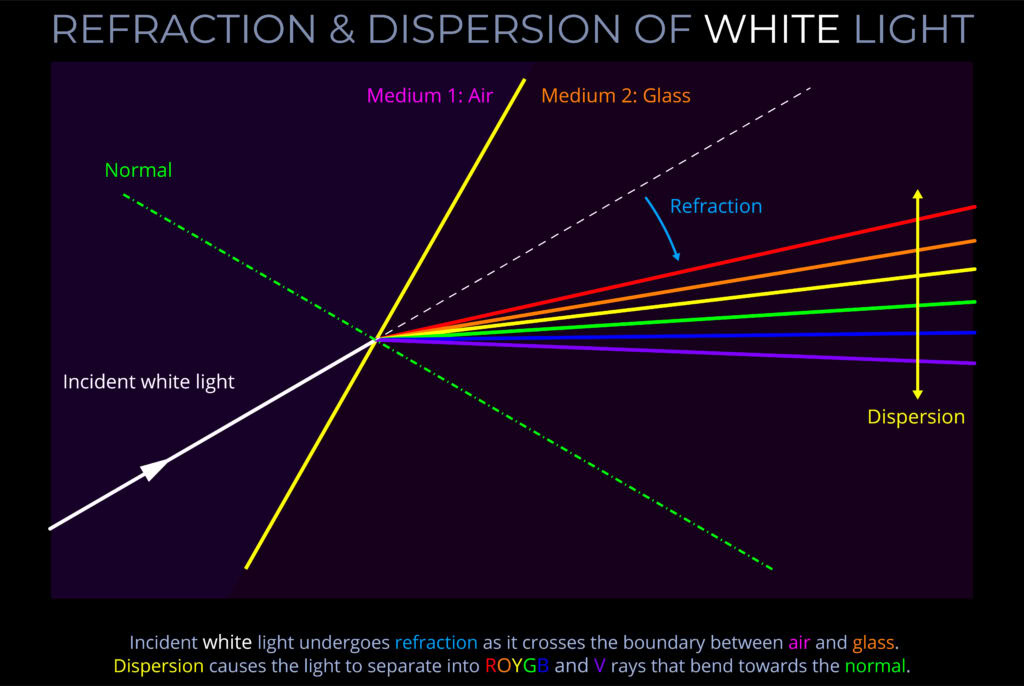
Refraction & Dispersion of White Light
The diagram illustrates chromatic dispersion:
- Chromatic dispersion is often simply called dispersion.
- The text below the image explains that dispersion takes place because the refractive index of the glass is different for each wavelength of light (ROYGBV).
- Chromatic dispersion takes place because the refractive index of the glass is different for each wavelength.
- White light containing all wavelengths of the visible spectrum disperses into a rainbow of colours.
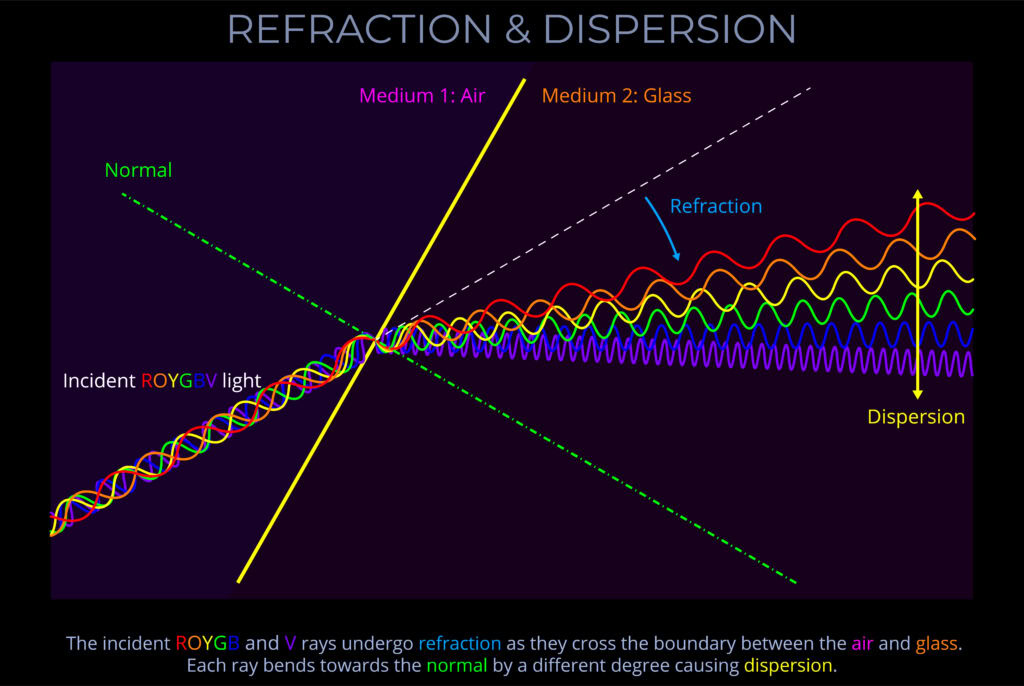
Refraction & Dispersion
The diagram shows different wavelengths of incident light approaching the boundary between air and glass.
- As each wavelength crosses the boundary into the glass it bends towards the normal (the dotted green line).
- Each incident wavelength is refracted towards the normal because it travels from air, the faster, less optically dense medium with a smaller refractive index into the glass, a slower, more optically dense medium with the higher refractive index.
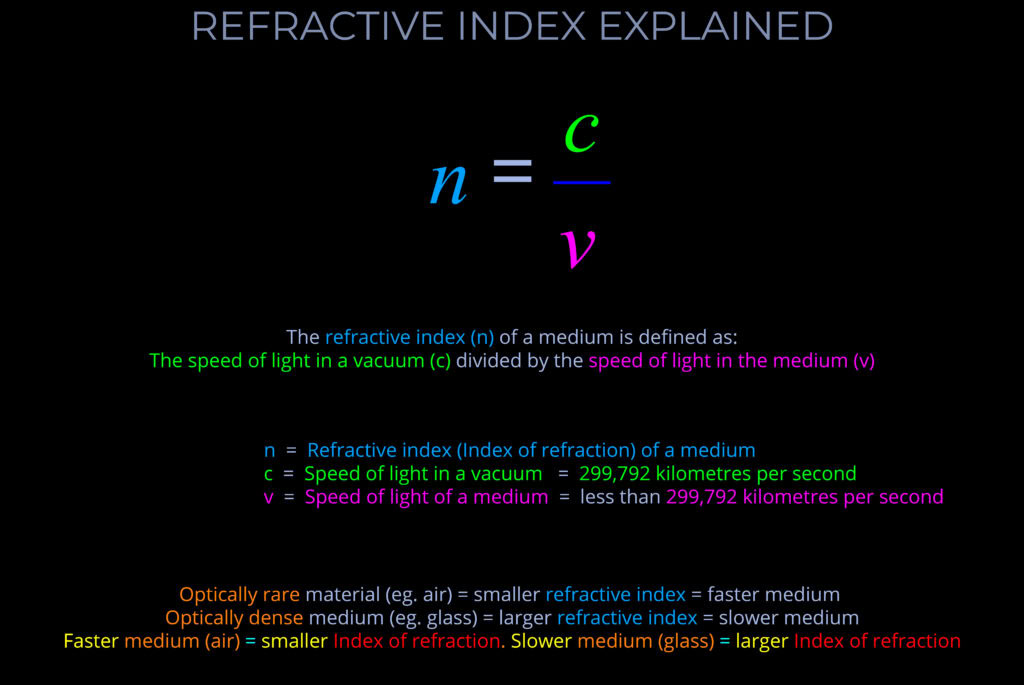
Refractive Index Explained
The diagram demonstrates the direct relationship between the speed of light as it travels through a vacuum (c) and the speed of light as it travels through any other transparent medium (v).
- Because the speed of light in a vacuum is always the same, the formula can be used to calculate:
- The refractive index (n) of a medium if the speed of light through the medium (v) is known.
- The speed of light in a medium (v) if its refractive index (n) is known
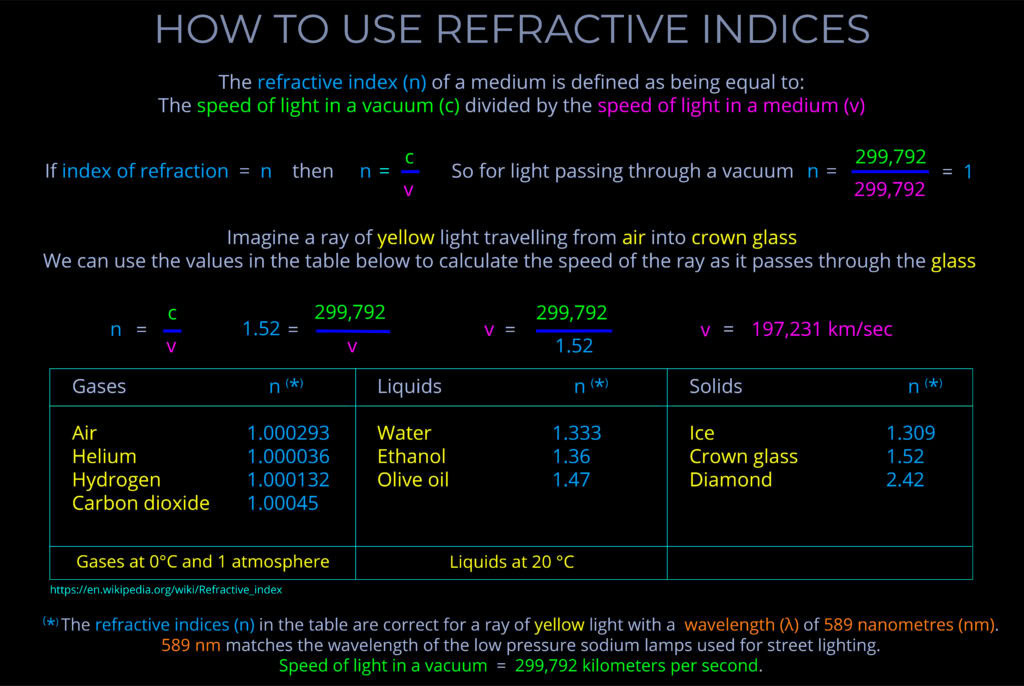
How to Use Refractive Indices
The diagram explains how to use the refractive index (sometimes called the index of refraction) of a medium to calculate the speed at which light will travels through it.
- The refractive index of a medium is defined as the speed of light in a vacuum (c) divided by the speed of light in a medium (v).

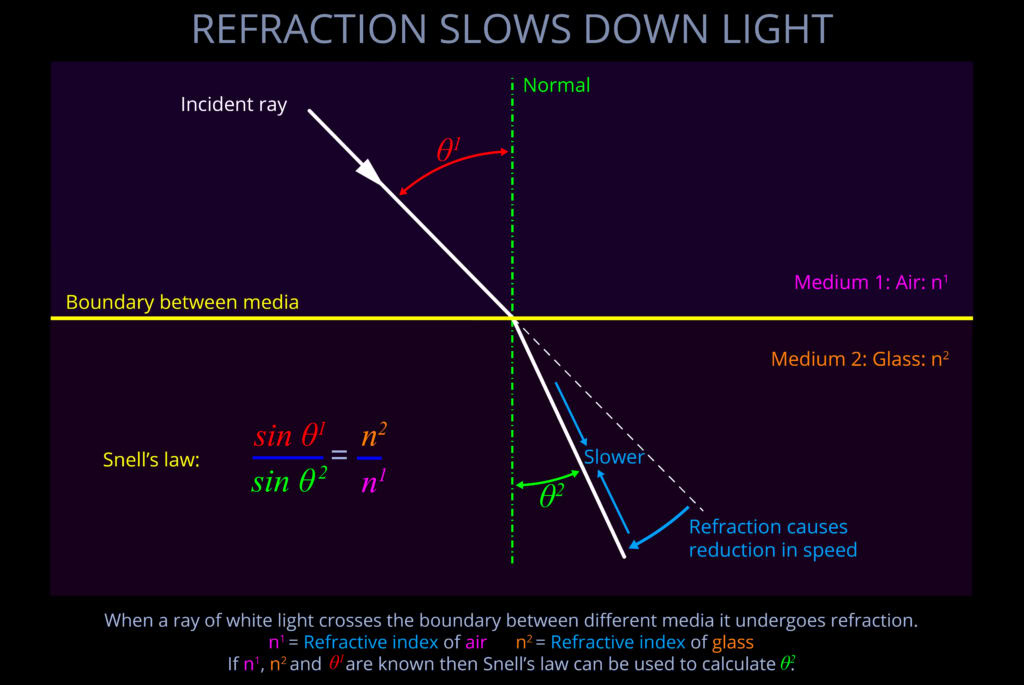
Law of Refraction Explained
The diagram deals with the Law of Refraction (Snell's law) and explains how to use the equation to predict what will happen to the direction in which light travels when it crosses the boundary between two transparent media.
The law defines the relationship between the angle of incidence and angle of refraction of a ray of light with reference to the refractive indices of both media. It can be stated as follows: When electromagnetic radiation (light) of a specific wavelength crosses the interface of any given pair of media, the ratio of the sines of the angles of incidence ...
The law defines the relationship between the angle of incidence and angle of refraction of a ray of light with reference to the refractive indices of both media. It can be stated as follows: When electromagnetic radiation (light) of a specific wavelength crosses the interface of any given pair of media, the ratio of the sines of the angles of incidence ...
Refraction Slows Down Light
This diagram is a new addition to the site! More information will be added ASAP 🙂 ...

Refraction Speeds Up Light
This diagram is a new addition to the site! More information will be added ASAP 🙂 ...

Chromatic Dispersion in a Prism
In this diagram a ray of incident light strikes one of the three rectangular surfaces at an angle so that it exits from the middle of another.
- The light source used produces white light which is focused into a narrow beam.
- As the ray enters the prism the angles of incidence and refraction are the same.
- When the light exits the prism the angles of incidence and refraction are the same.

Sunlight Reflects off a Fish in Water
This diagram is a new addition to the site! More information will be added ASAP 🙂 ...
Reflection & Total Internal Reflection
This diagram is a new addition to the site! More information will be added ASAP 🙂 ...

Position of an Object in Water
This diagram is a new addition to the site! More information will be added ASAP 🙂 ...

How to See a Rainbow
This is one of a set of almost 40 diagrams exploring Rainbows.
Each diagram appears on a separate page and is supported by a full explanation.
Each diagram appears on a separate page and is supported by a full explanation.
- Follow the links embedded in the text for definitions of all the key terms.
- For quick reference don't miss the summaries of key terms further down each page.

Take a Photo of a Rainbow
This is one of a set of almost 40 diagrams exploring Rainbows.
Each diagram appears on a separate page and is supported by a full explanation.
Each diagram appears on a separate page and is supported by a full explanation.
- Follow the links embedded in the text for definitions of all the key terms.
- For quick reference don't miss the summaries of key terms further down each page.

Rainbow Anatomy
This is one of a set of almost 40 diagrams exploring Rainbows.
Each diagram appears on a separate page and is supported by a full explanation.
Each diagram appears on a separate page and is supported by a full explanation.
- Follow the links embedded in the text for definitions of all the key terms.
- For quick reference don't miss the summaries of key terms further down each page.

Rainbows Seen From the Air
This is one of a set of almost 40 diagrams exploring Rainbows.
Each diagram appears on a separate page and is supported by a full explanation.
Each diagram appears on a separate page and is supported by a full explanation.
- Follow the links embedded in the text for definitions of all the key terms.
- For quick reference don't miss the summaries of key terms further down each page.

Rainbows Seen From the Ground
This is one of a set of almost 40 diagrams exploring Rainbows.
Each diagram appears on a separate page and is supported by a full explanation.
Each diagram appears on a separate page and is supported by a full explanation.
- Follow the links embedded in the text for definitions of all the key terms.
- For quick reference don't miss the summaries of key terms further down each page.

A Rainbow is an Optical Phenomenon
This is one of a set of almost 40 diagrams exploring Rainbows.
Each diagram appears on a separate page and is supported by a full explanation.
Each diagram appears on a separate page and is supported by a full explanation.
- Follow the links embedded in the text for definitions of all the key terms.
- For quick reference don't miss the summaries of key terms further down each page.

Sun Observer & Rainbow Share Axis
This is one of a set of almost 40 diagrams exploring Rainbows.
Each diagram appears on a separate page and is supported by a full explanation.
Each diagram appears on a separate page and is supported by a full explanation.
- Follow the links embedded in the text for definitions of all the key terms.
- For quick reference don't miss the summaries of key terms further down each page.

Lower the Sun Higher the Rainbow
This is one of a set of almost 40 diagrams exploring Rainbows.
Each diagram appears on a separate page and is supported by a full explanation.
Each diagram appears on a separate page and is supported by a full explanation.
- Follow the links embedded in the text for definitions of all the key terms.
- For quick reference don't miss the summaries of key terms further down each page.

Higher the Sun Lower the Rainbow
This is one of a set of almost 40 diagrams exploring Rainbows.
Each diagram appears on a separate page and is supported by a full explanation.
Each diagram appears on a separate page and is supported by a full explanation.
- Follow the links embedded in the text for definitions of all the key terms.
- For quick reference don't miss the summaries of key terms further down each page.
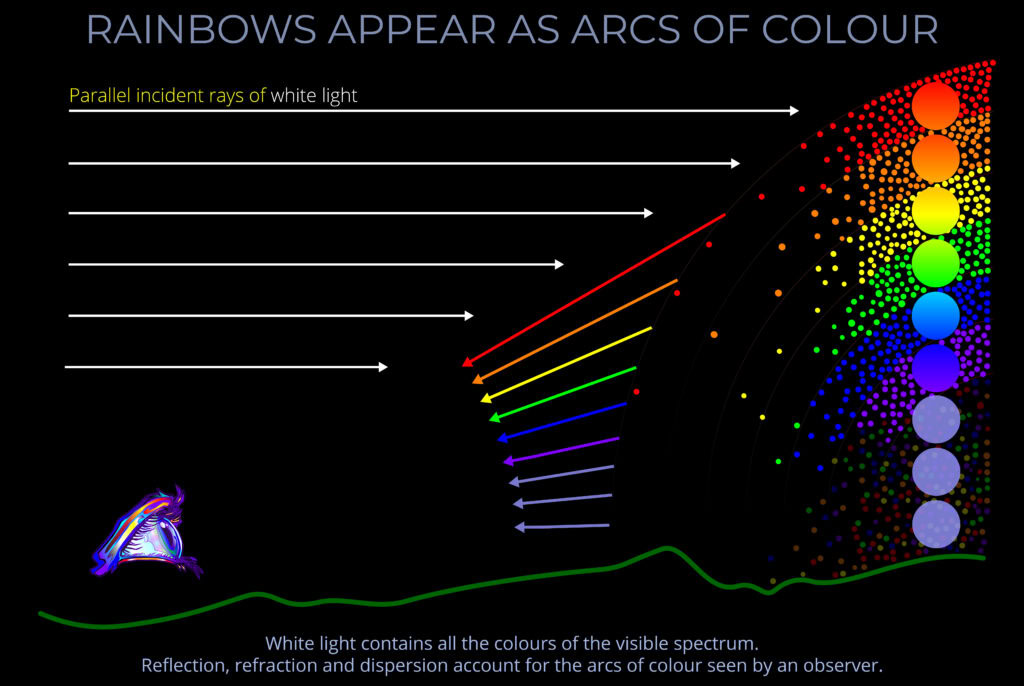
Rainbows Appear as Arcs of Colour
This is one of a set of almost 40 diagrams exploring Rainbows.
Each diagram appears on a separate page and is supported by a full explanation.
Each diagram appears on a separate page and is supported by a full explanation.
- Follow the links embedded in the text for definitions of all the key terms.
- For quick reference don't miss the summaries of key terms further down each page.