Overlapping Beams of C M & Y Make White
$0.00
This diagram shows the effect of projecting cyan, magenta and yellow light onto a neutral coloured surface.
- In the RGB colour model, cyan, magenta and yellow are secondary colours. Notice what colours are produced where they overlap!
- Imagine that the three circles of colour (cyan, magenta and yellow) are produced by torches shining beams of light so they overlap one another.
- Overlapping pairs of primary colours produce secondary colours.
- But in this diagram overlapping pairs of secondary colours produce primary colours
- The area where all three primary colours overlap is white.
Understanding the diagram
- The diagrams illustrate how the RGB colour model works in practice.
- Each torch emits light at the same intensity.
- Each torch points towards a different area of the surface.
- The light in each case is produced by two wavelengths so produces an RGB colour.
Description
Overlapping Beams of C, M & Y Make White
TRY SOME QUICK QUESTIONS AND ANSWERS TO GET STARTED
About the diagram
About the diagram
- This diagram shows the effect of projecting lights producing the RGB secondary colours (cyan, magenta and yellow) onto a neutral coloured surface.
- Imagine that the three circles of colour (cyan, magenta and yellow) are produced by torches shining beams of light so they overlap one another.
- In the RGB colour model, cyan, magenta and yellow are secondary colours. Notice what colours are produced where they overlap – it’s the three primary colours!
- Overlapping pairs of primary colours produce secondary colours.
- Overlapping pairs of secondary colours produce primary colours.
- Remember that the area where all three primary colours or all three secondary colours overlap is white.
About the RGB colour model
- RGB colour is an additive colour model that combines wavelengths of light corresponding with the red, green and blue primary colours to produce other colours.
- RGB colour is called a model because it is a method that can be followed to produce any colour from a combination of red, green and blue light.
- Red, green and blue are called additive primary colours in an RGB colour model because they can be added together to produce any other colour.
- When mixing light, each RGB primary colour is called a component of the resulting colour.
- Different colours are produced by varying the intensity of the component colours between fully off and fully on.
- When any two fully saturated RGB primaries are combined they produce a secondary colour: yellow, cyan or magenta.
- When fully saturated red, green and blue primary colours are all combined together they produce white.
- Some RGB colour models can produce over 16 million colours by varying the proportion and intensity of each of the three component primary colours.
- The additive RGB colour model cannot be used for mixing different colours of pigments, paints, inks, dyes or powders. To understand these colourants find out about subtractive colour.
- The RGB colour model does not define the precise wavelength or band of wavelengths for the primary colours red, green and blue.
- When the exact composition of primary colours are defined, the colour model then becomes an absolute colour space.
Some key terms
- A colour model, underpinned by a colour theory, provides a precise and replicable approach to understanding:
- How the human eye perceives light and interprets colour.
- Different types of colour such as the colours produced when mixing lights, pigments or inks.
- How to manage the diverse ways colour is processed by equipment such as cameras, digital screens and printers.
- Whether or not we recognize it, whenever we are working with colour, we are adopting a colour theory, a colour model and a colour space.
- For more information see https://lightcolourvision.org/dictionary/definition/colour-model/
The trichromatic colour model is a theory of colour that establishes terms, rules and methods to enable human colour vision to be dealt with in both systematic and practical ways.
A colour model is the how-to part of colour theory. Together they establish terms and definitions, rules or conventions and a system of notation for encoding colours and their relationships with one another.
A colour model is a way of:
- Making sense of the colours we see around us in the world.
- Understanding the relationship of colours to one another.
- Understanding how to mix each type of coloured media to produce predictable results.
- Specifying colours using names, codes, notation, equations etc.
- Organising and using colours for different purposes.
- Using colours in predictable and repeatable ways.
- Working out systems and rules for mixing and using different types of colour.
- Creating colour palettes, gamuts and colour guides.
- The CMY colour model deals with a subtractive method of colour mixing. It can be used to explain and provide practical methods of combining three transparent inks and filters (cyan, magenta and yellow) to produce a wide range of other colours and particularly to produce realistic effects when printing digital images onto highly reflective white paper.
- The primary colours in the CMY colour model are cyan, magenta and yellow.
- The CMY colour model is a subtractive colour model used with transparent or translucent inks or filters.
- The CMY colour model along with its system of notation enables an exact and reproducible approach to colour printing and other similar applications.
- The CMY colour model is deeply embedded in all contemporary digital printer technologies and underpins industrial standards for the printing industry.
- Find out more here https://lightcolourvision.org/dictionary/definition/cmy-colour-model/
- A colour wheel is a circular diagram divided into segments, featuring primary colours, and used to visualize the result of colour mixing.
- Colour wheels can enhance understanding of colour relationships and assist with the accurate selection and reproduction of colours.
- A colour wheel starts with segments representing primary colours. Additional segments are added between them to explore the outcome of mixing adjacent primary colours.
- By adding more segments between existing ones, further mixing of adjacent colours can be explored.
- A colour wheel exploring the additive RGB colour model starts with red, green, and blue primary colours.
- A colour wheel exploring the subtractive CMY colour model starts with cyan, magenta, and yellow primary colours.
White light is the name given to visible light that contains all wavelengths of the visible spectrum at equal intensities.
- As light travels through a vacuum or a medium it is described as white light if it contains all the wavelengths of visible light.
- As light travels through the air it is invisible to our eyes.
- When we look around we see through the air because it is very transparent and light passes through it.
- The term white light doesn’t mean light is white as it travels through the air.
- One situation in which light becomes visible is when it reflects off the surface of an object.
- When white light strikes a neutral coloured object and all wavelengths are reflected then it appears white to an observer.
Primary colours are a set of colours from which others can be produced by mixing (pigments, dyes etc.) or overlapping (coloured lights).
- The human eye, and so human perception, is tuned to the visible spectrum and so to spectral colours between red and violet. It is the sensitivity of the eye to the electromagnetic spectrum that results in the perception of colour.
- A set of primary colours is a set of pigmented media or coloured lights that can be combined in varying amounts to produce a wide range of colour.
- This process of combining colours to produce other colours is used in applications intended to cause a human observer to experience a particular range of colours when represented by electronic displays and colour printing.
- Additive and subtractive models have been developed that predict how wavelengths of visible light, pigments and media interact.
- RGB colour is a technology used to reproduce colour in ways that match human perception.
- The primary colours used in colour-spaces such as CIELAB, NCS, Adobe RGB (1998) and sRGB are the result of an extensive investigation of the relationship between visible light and human colour vision.
Diagrams are free to download
Downloads: Slides or Illustrations
DOWNLOAD DIAGRAMS
- SLIDES are optimized for viewing on-screen.
- ILLUSTRATIONS are optimized for printing on A4 pages in portrait format.
SLIDES
- Slides are available in JPG and AI (Adobe Illustrator) file formats.
- Titles: Slides have titles.
- Backgrounds: Black.
- Size: 1686 x 1124 pixels (3:2 aspect ratio).
ILLUSTRATIONS
- Illustrations are available in JPG and AI two file formats.
- Titles: No titles.
- Backgrounds: White.
- Size: 1686 x 1124 (3:2 aspect ratio). So all illustrations reproduce at the same scale when inserted into Word documents etc.
- Labels: Calibri 24pt Italic.
File formats: JPG & AI
DOWNLOAD THE DIAGRAM ON THIS PAGE AS A JPG FILE
- JPG (JPEG) diagrams are 1686 x 1124 pixels (3:2 aspect ratio).
- If a JPG diagram doesn’t fit your needs, you can download it as an AI (Adobe Illustrator) file and edit it yourself.
- JPG files can be placed or pasted directly into MS Office documents.
DOWNLOAD THE DIAGRAM ON THIS PAGE AS AN AI file
- All AI (Adobe Illustrator) diagrams are 1686 x 1124 pixels (3:2 aspect ratio).
- All our diagrams are created in Adobe Illustrator as vector drawings.
- Save as or export AI files to other formats including PDF (.pdf), PNG (.png), JPG (.jpeg) and SVG(.svg) etc.
Spelling: UK & US
We use English (UK) spelling by default here at lightcolourvision.org.
COPY & PASTING TEXT
- After copy/pasting text please do a spell-check to change our spelling to match your own document.
DOWNLOAD DIAGRAMS
- Download AI versions of diagrams to change the spelling or language used for titles, labels etc.
- We are adding American English (US) versions of diagrams on request. Just contact us and let us know what you need.
- When downloading JPG versions of diagrams, look out for JPG (UK) or JPG (US) in the download dialogue box.
Download agreement
DOWNLOAD AGREEMENT
Light, Colour, Vision & How To See More (https://lightcolourvision.org) : Copyright © 2015-2022 : MediaStudies Trust.
Unless stated otherwise the author of all images and written content on lightcolourvision.org is Ric Mann.
ALL RIGHTS RESERVED
No part of this website may be copied, displayed, extracted, reproduced, utilised, stored in a retrieval system or transmitted in any form or by any means, electronic, mechanical or otherwise including but not limited to photocopying, recording, or scanning without the prior written permission of MediaStudies Trust.
EXCEPTIONS
Exceptions to the above statement are made for personal, educational and non-profit purposes:
Before downloading, cutting and pasting or reproducing any information, images or other assets found on lightcolourvision.org we ask you to agree to the following terms:
- All information, images and other assets displayed and made available for download on the lightcolourvision.org website are copyright. This means there are limitations on how they can be used.
- All information, images and other assets displayed or made available for download are solely and exclusively to be used for personal, educational and non-profit purposes.
- When you find the resources you need, then part of the download process involves you (the user) ticking a box to let us (at lightcolourvision.org) know we both agree on how the material can be used.
- Please contact kiaora.lightcolourvision@gmail.com before considering any use not covered by the terms of the agreement above.
The copyright to all information, images and all other assets (unless otherwise stated) belongs to:
The Trustees. MediaStudies Trust
111 Lynbrooke Avenue
Blockhouse Bay
Auckland 0600
New Zealand
kiaora.lightcolourvision@gmail.com
We love feedback


Your name and email address will be used solely to provide you with information you have specifically requested. See our privacy policy at https://lightcolourvision.org/privacy/.
We welcome your feedback 🙂
Related products
-


Blue Light on a Dark Surface
$0.00 Select options This product has multiple variants. The options may be chosen on the product page -


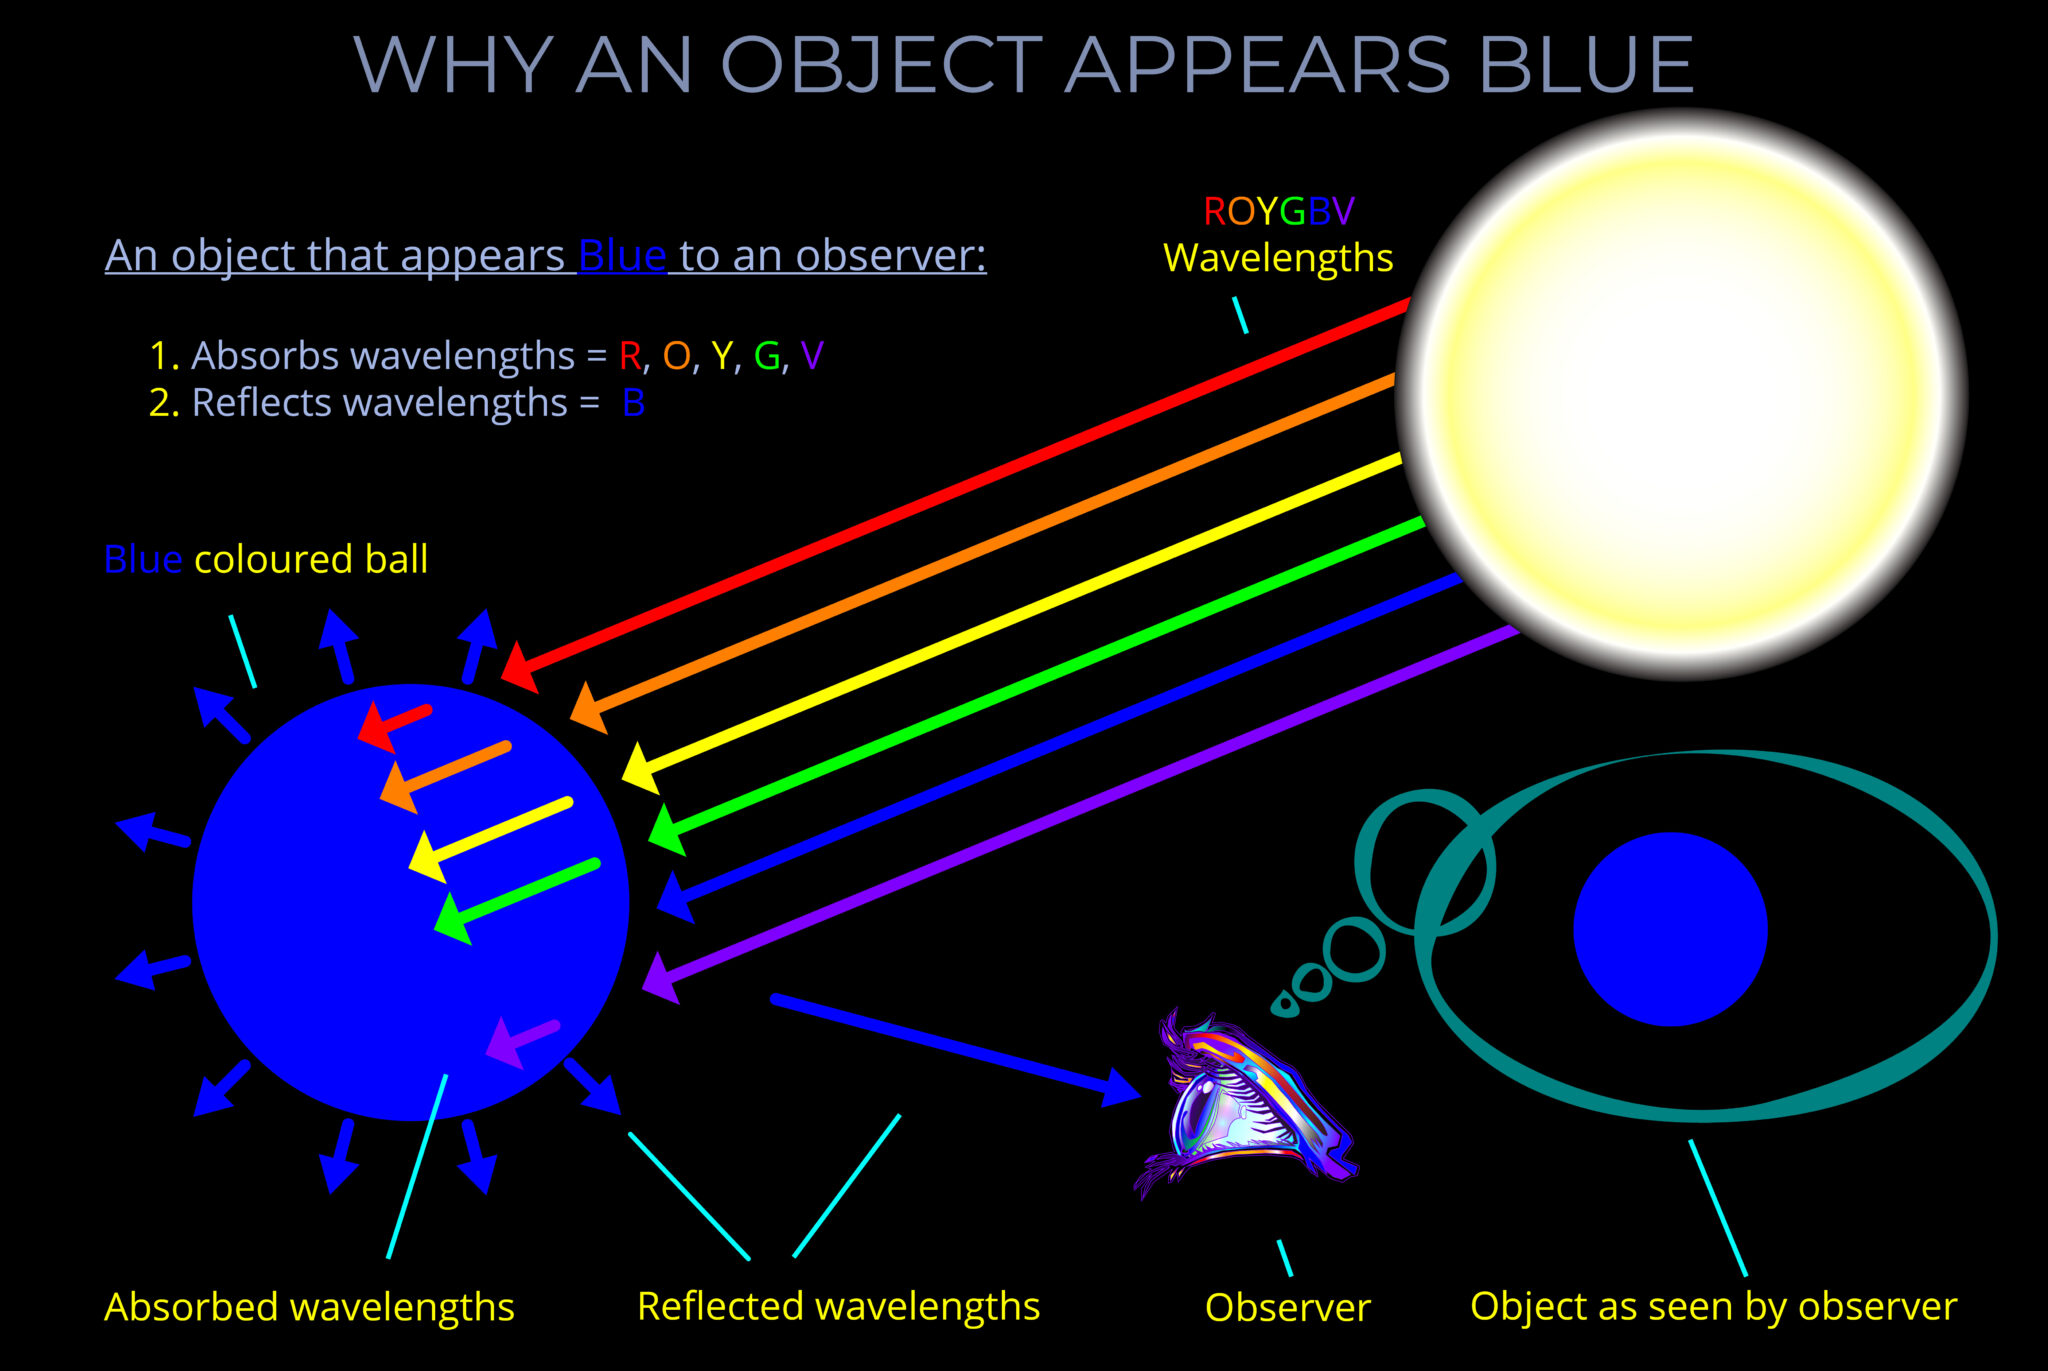
Why an Object Appears Blue
$0.00 Select options This product has multiple variants. The options may be chosen on the product page -


Why an Object Appears Cyan
$0.00 Select options This product has multiple variants. The options may be chosen on the product page