Colour Brightness & Angular Distance
£0.00
This is one of a set of almost 40 diagrams exploring Rainbows.
Each diagram appears on a separate page and is supported by a full explanation.
- Follow the links embedded in the text for definitions of all the key terms.
- For quick reference don’t miss the summaries of key terms further down each page.
Description
Colour Brightness & Angular Distance
TRY SOME QUICK QUESTIONS AND ANSWERS TO GET STARTED
About the diagram
Overview of diagram
- There is no property belonging to electromagnetic radiation that causes a rainbow to appear as bands of colour to an observer.
- The fact that we do see distinct bands in the arc of a rainbow is often described as an artefact of human colour vision.
- This diagram deals with a related phenomenon, the fact that some of the bands of colour within a rainbow appear brighter and more intense than others.
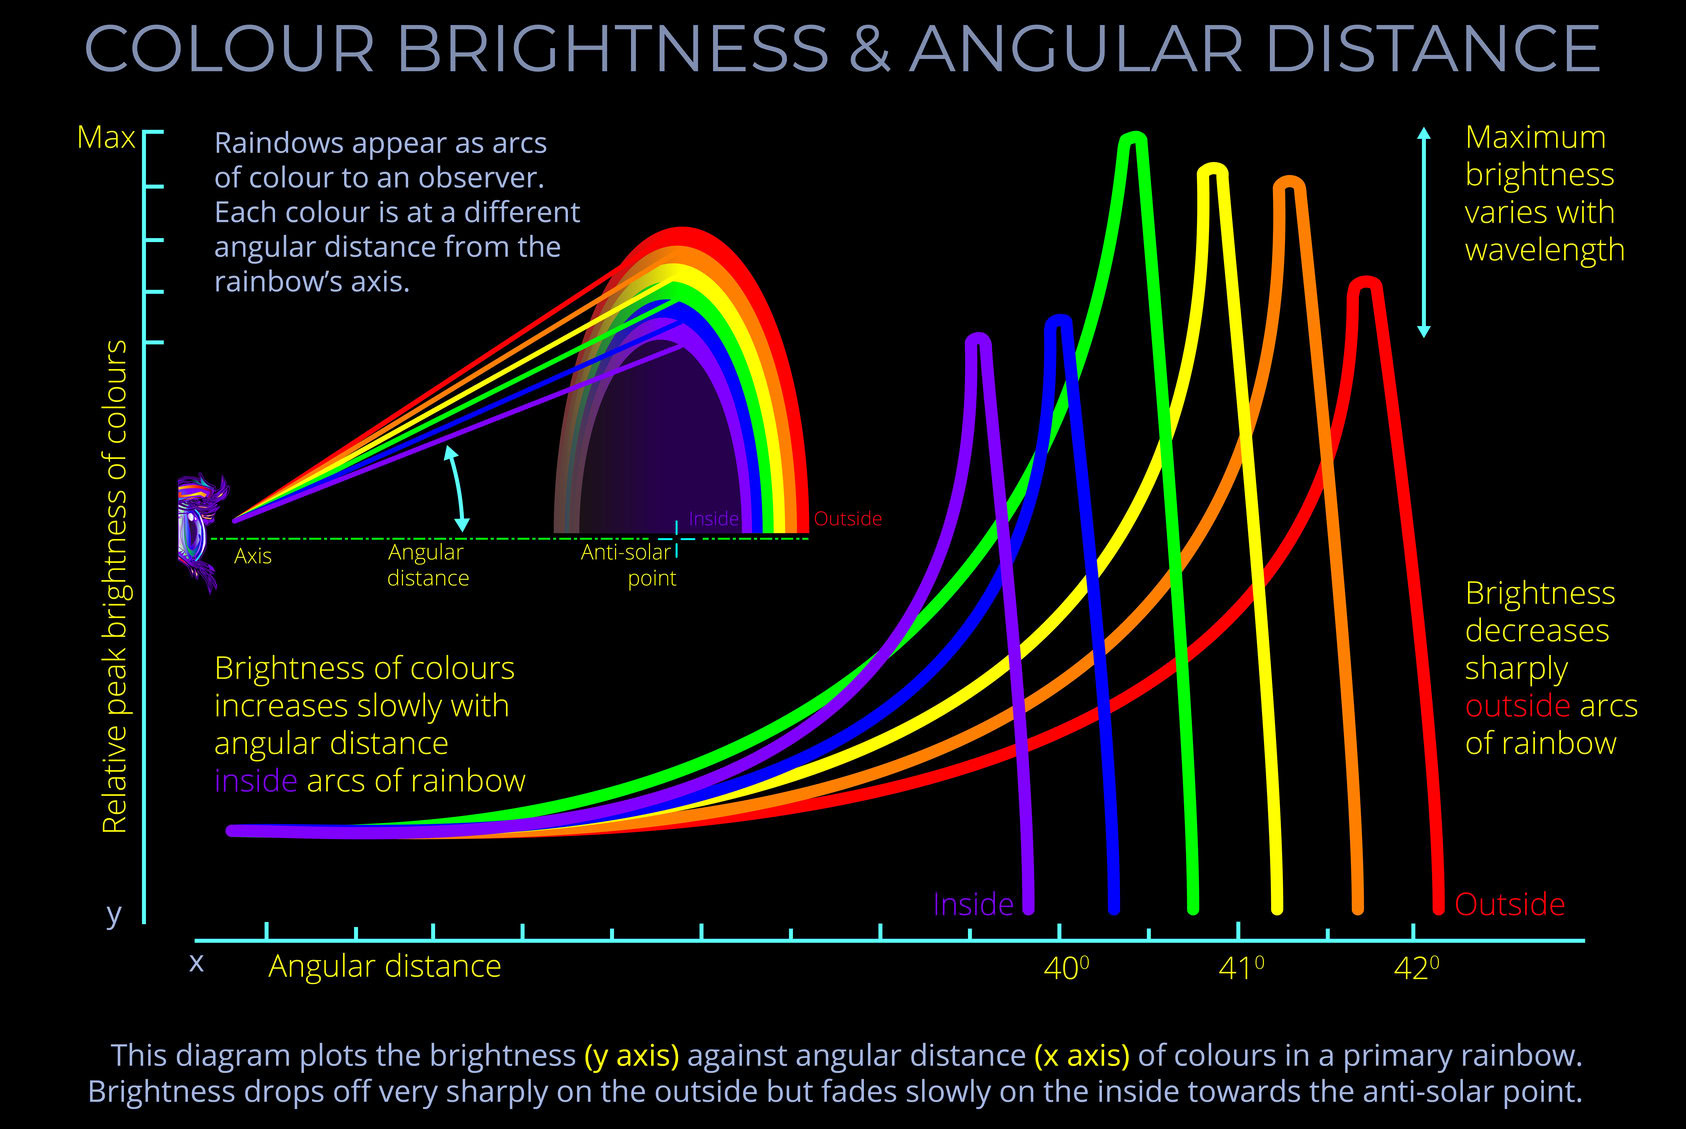
- The diagram plots the differences in the apparent brightness of each colour as it appears to an observer looking at a primary rainbow.
- The plot of each curve shows that as angular distance increases, brightness also slowly increases.
- At an angular distance of 40.70 the brightness of violet suddenly increases to a peak and then quickly declines to zero.
- Each subsequent band undergoes a similar sudden increase towards its own peak at a progressively larger angular distance.
- Having reached peak brightness, each band quickly declines to zero.
- Remember that the angular distance of any colour can be measured vertically from the rainbow axis to the apex of the arcs or horizontally to left or right.
Discs of colour
- It is the slow increase in brightness of each band of colour from the anti-solar point (the centre of a rainbow) towards the circumference that suggests that each band can be thought of as a separate disc.
- Each disc is composed of a band of wavelengths and each has a different diameter.
- Each band of wavelengths appear to be a distinctly different colour to an observer.
- The circumference of each disc marks the region of peak brightness.
- The sharp outer edge of each disc corresponds with the point at which its brightness quickly drops to zero.
Reading the diagram
- This diagram plots the brightness (y axis) against angular distance (x axis) of the different bands of colour in a primary rainbow.
- The main diagram is a graph showing:
- x axis = A scale with angular distance increasing from left to right
- y axis = A scale with relative peak brightness increasing from bottom to top
- The plots for the different bands of colour colour show that their brightness increases and peaks at different angular distances.
- The diagram suggests that the relative brightness of each bans in ascending order in violet, blue, red, orange, yellow and green.
- The inset diagram in the top left shows a side-on view of an observer and rainbow to remind viewers that the angular distance of any colour can be measured vertically from the rainbow axis to the apex of the arcs or horizontally to left or right.
About rainbow colour
About angular distance
Rainbows: In detail
Some key terms
On a sunny day, if you stand with the Sun at your back and look at the ground, the shadow of your head will align with the antisolar point.
- The antisolar point is the position directly opposite the Sun, around which the arcs of a rainbow appear. An imaginary straight line can always be drawn that passes through the Sun, the eyes of an observer, and the antisolar point, which is the geometric centre of a rainbow.
- This concept corresponds with what an observer sees in real life: the idea that a rainbow has a center. From a side view, the centre of a rainbow is called the antisolar point, so named because it is opposite the Sun relative to the observer’s position.
- Unless observed from the air, the antisolar point is always below the horizon. Both primary and secondary rainbows share the same antisolar point, as do higher-order bows, such as fifth and sixth-order rainbows.
The amplitude of an electromagnetic wave is directly connected with the amount of energy it carries.
- In a wave diagram, the amplitude is represented as the distance from the centre line (or midpoint) of a wave to the top of a crest or the bottom of a corresponding trough.
- When the amplitude of an electromagnetic wave increases, the overall distance between any peak and the next trough also increases.
- The quantity of energy carried by an electromagnetic wave is proportional to the amplitude squared.
- Amplitude has an indirect correlation with the perception of the intensity of light and the brightness of colour as perceived by an observer because additional factors such as phase and interference must be taken into account.
When discussing rainbows, angular distance is the angle between the line from the observer to the centre of the rainbow (rainbow axis) and the line from the observer to a specific colour within the arc of a rainbow.
- See this diagram for an explanation: Angular distance & Raindrop colour
- Angular distance is one of the angles measured on a ray-tracing diagram that illustrates the sun, an observer, and a rainbow from a side view.
- Think of angular distance as the angle between the line to the centre of a rainbow down which an observer looks and the line to a specific colour in its arc. The red light is deviated by about 42.4° and violet light by about 40.7°.
The visible spectrum is the range of wavelengths of the electromagnetic spectrum that correspond with all the different colours we see in the world.
- As light travels through the air it is invisible to our eyes.
- Human beings don’t see wavelengths of light, but they do see the spectral colours that correspond with each wavelength and colours produced when different wavelengths are combined.
- The visible spectrum includes all the spectral colours between red and violet and each is produced by a single wavelength.
- The visible spectrum is often divided into named colours, though any division of this kind is somewhat arbitrary.
- Traditional colours referred to in English include red, orange, yellow, green, blue, and violet.
An artificial light source is any source of light created by humans, as opposed to natural light sources like the sun or stars. Artificial light sources are generated by converting different forms of energy into light.
- There are several major categories of artificial light sources such as:
- Incandescent: These work by heating a filament until it glows, emitting light (traditional light bulbs).
- Fluorescent: Electric current triggers gas inside the bulb to produce ultraviolet light, which a phosphor coating converts into visible light.
- LED (Light-Emitting Diode): Electricity excites semiconductors, causing them to emit light.
- Gas-discharge lamps: Electric current passes through a gas, producing bright light (e.g., neon signs, street lamps).
ROYGBV are the initials for the sequence of colours that make up the visible spectrum: red, orange, yellow, green, blue, and violet.
- The visible spectrum refers to the range of colours visible to the human eye.
- White light, when passed through a prism, separates into a sequence of individual colours corresponding with ROYGBV which is the range of colours visible to the human eye.
- White light separates into ROYGBV because different wavelengths of light bend at slightly different angles as they enter and exit the prism.
- ROYGBV helps us remember the order of these spectral colours starting from the longest wavelength (red) to the shortest (violet).
- A rainbow spans the continuous range of spectral colours that make up the visible spectrum.
- The visible spectrum is the small band of wavelengths within the electromagnetic spectrum that corresponds with all the different colours we see in the world.
- The fact that we see the distinct bands of colour in a rainbow is an artefact of human colour vision.
Intensity measures the amount of light energy passing through a unit area perpendicular to the direction of light propagation.
- Intensity measures the amount of energy carried by a light wave or stream of photons.
- When light is modelled as a wave, intensity is proportional to the square of the amplitude.
- When light is modelled as a particle, intensity is proportional to the number of photons present at any given point in time.
- The intensity of light falls off as the inverse square of the distance from a point light source increases.
- Light intensity at any given distance from a light source is directly related to the power of the light source and the distance from the source.
- The power of a light source describes the rate at which energy is emitted and is measured in watts.
- The intensity of light is measured in watts per square meter (W/m²) and is also commonly expressed in lux (lx).
The visible part of the electromagnetic spectrum is called the visible spectrum.
- The visible spectrum is the range of wavelengths of the electromagnetic spectrum that correspond with all the different colours we see in the world.
- As light travels through the air it is invisible to our eyes.
- Human beings don’t see wavelengths of light, but they do see the spectral colours that correspond with each wavelength and colours produced when different wavelengths are combined.
- The visible spectrum includes all the spectral colours between red and violet and each is produced by a single wavelength.
- The visible spectrum is often divided into named colours, though any division of this kind is somewhat arbitrary.
- Traditional colours referred to in English include red, orange, yellow, green, blue, and violet.
Rainbow colours are the colours seen in rainbows and in other situations where visible light separates into its different wavelengths and the spectral colours corresponding with each wavelength become visible to the human eye.
- The rainbow colours (ROYGBV) in order of wavelength are red (longest wavelength), orange, yellow, green, blue and violet (shortest wavelength).
- It is the sensitivity of the human eye to this small part of the electromagnetic spectrum that results in our perception of colour.
- The names of rainbow colours are a matter more closely related to the relationship between perception and language than anything to do with physics or scientific accuracy. While the spectrum of light and the colours we see are both determined by wavelength, it’s our eyes and brains that turn these differences in light into the colours we experience.
- In the past, rainbows were sometimes portrayed as having seven colours: red, orange, yellow, green, blue, indigo and violet.
- Modern portrayals of rainbows reduce the number of colours to six spectral colours, ROYGBV.
- In reality, the colours of a rainbow form a continuous spectrum and there are no clear boundaries between one colour and the next.
Diagrams are free to download
Related products
-

Refraction & Dispersion
£0.00 Select options This product has multiple variants. The options may be chosen on the product page -
Why an Object Appears Yellow
£0.00 Select options This product has multiple variants. The options may be chosen on the product page -
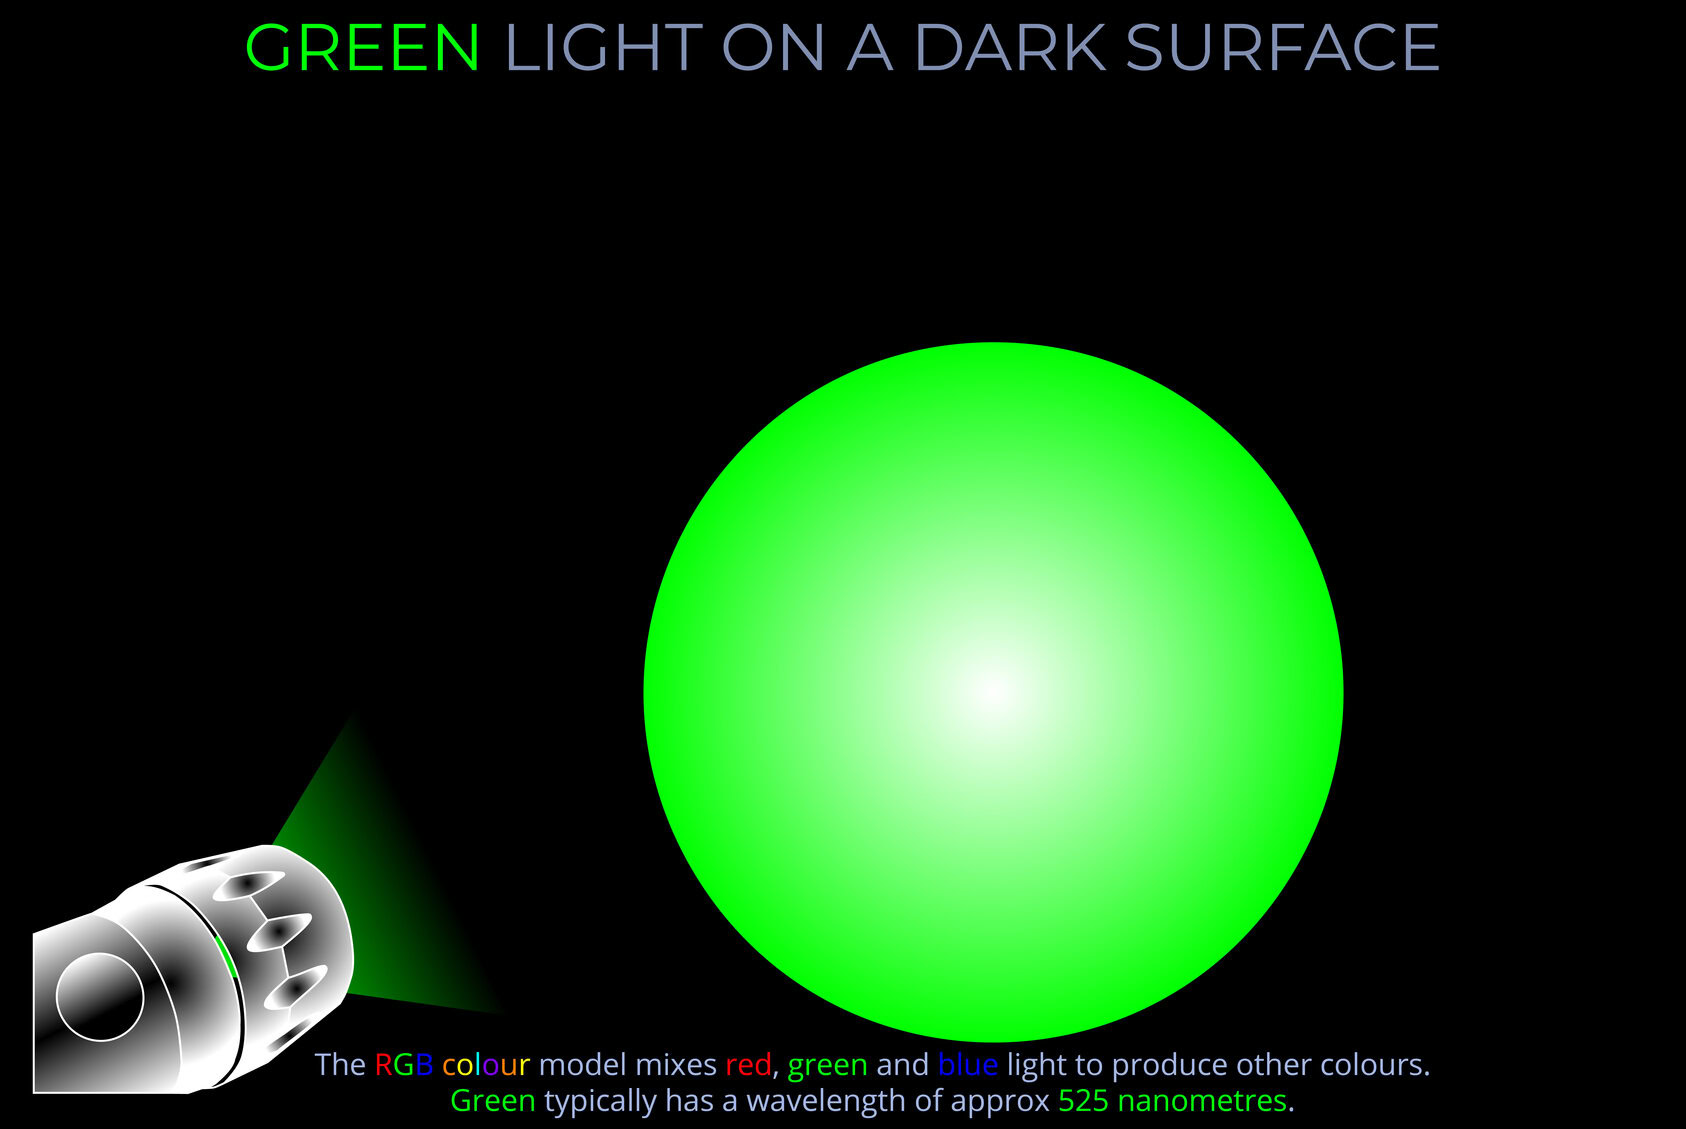
Green Light on a Dark Surface
£0.00 Select options This product has multiple variants. The options may be chosen on the product page