Wavelengths Between Red & Violet
£0.00
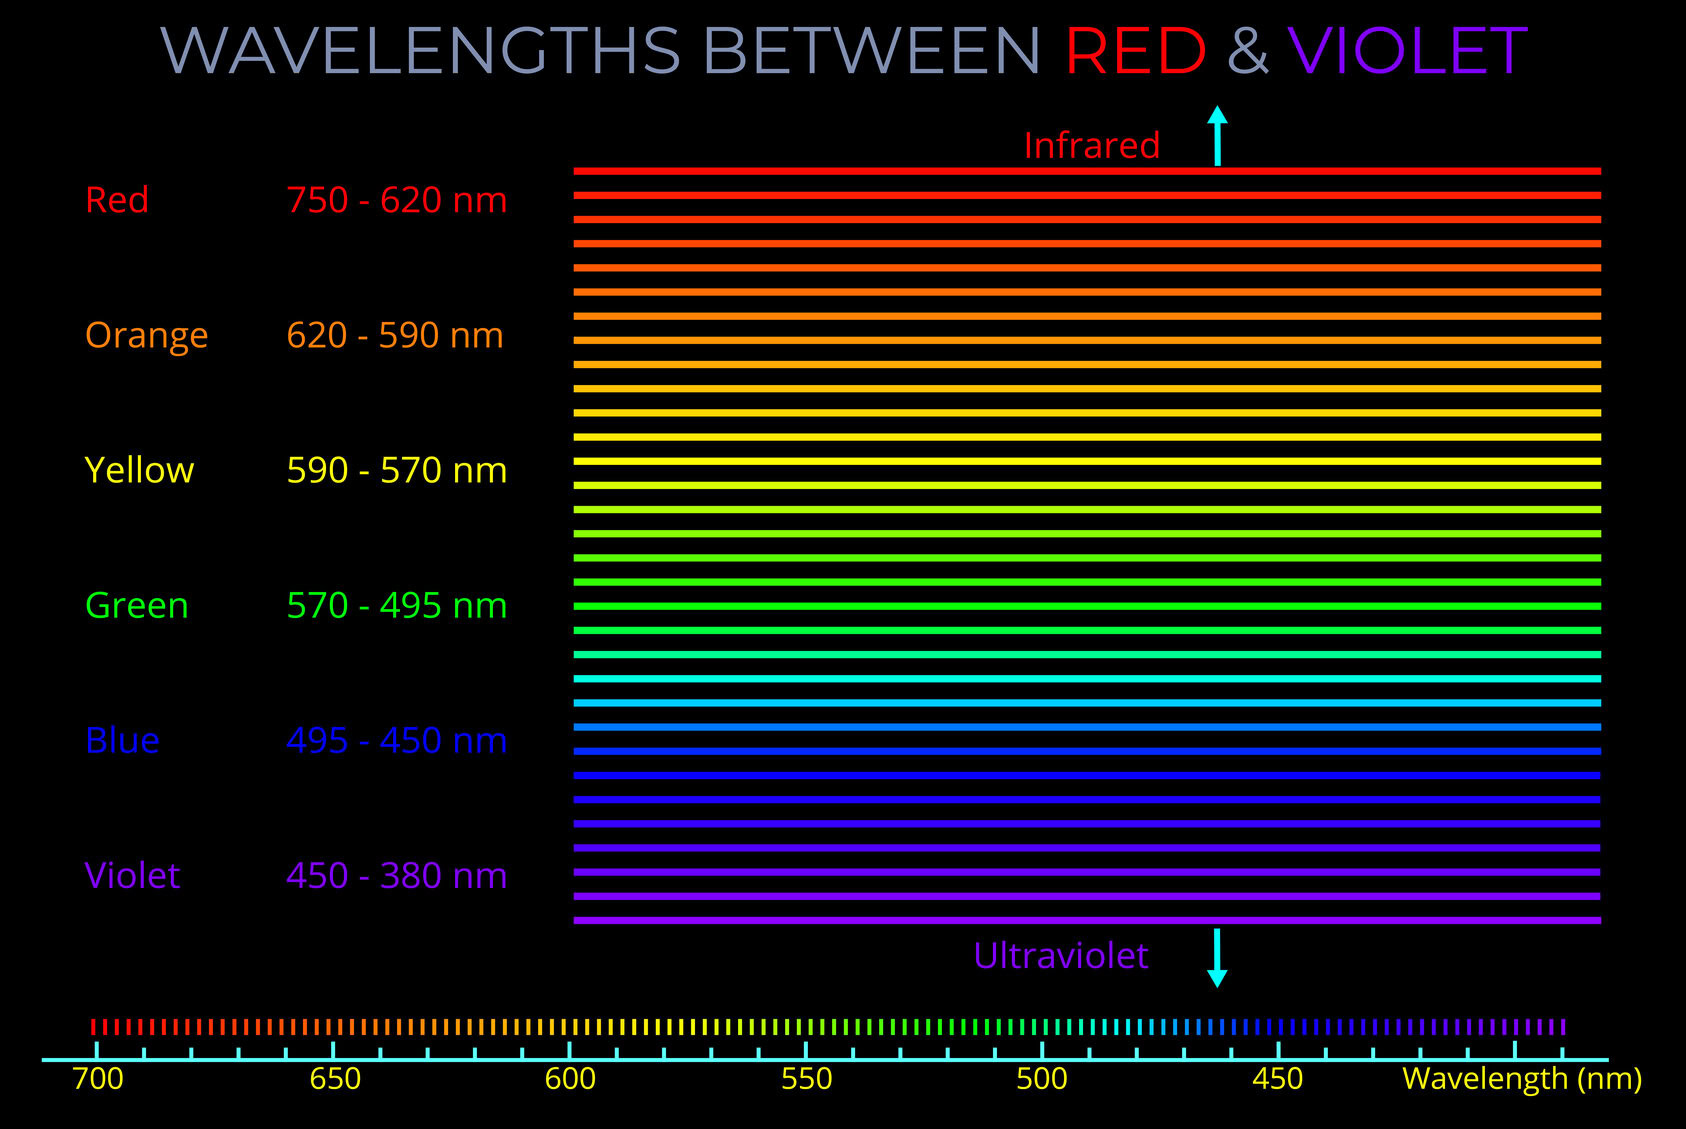
This diagram is about which wavelengths of electromagnetic radiation correspond with the different colours we see in the world.
It shows that whilst the visible spectrum often appears to an observer to be made up of six bands of colour, every wavelength between 700 and 380 nanometres corresponds with a different colour.
The scale along the bottom of the diagram is marked in nanometres with the corresponding colours shown above.
Remember that:
- Objects appear to be different colours to an observer depending on the wavelengths they reflect.
- The name given to light that contains all wavelengths of the visible spectrum is white light.
- When all wavelengths contained in white light reflect off a neutral coloured surface then the object appears white to an observer.
- When one or several bands of wavelengths reflect off a neutral coloured surface then the object appears coloured to an observer.
- The colour an observer sees depends on the wavelengths of visible light emitted by a light source and on which of those wavelengths are reflected off an object.
- Although a human observer can distinguish between many thousands of wavelengths of light in the visible spectrum our brains often produce the impression of bands of colour.
Description
Wavelengths Between Red & Violet
TRY SOME QUICK QUESTIONS AND ANSWERS TO GET STARTED
About the diagram
About the diagram
- This diagram is about which wavelengths of electromagnetic radiation correspond with the different colours we see in the world.
- It shows that whilst the visible spectrum often appears to an observer to be made up of six bands of colour, every wavelength between 700 and 380 nanometres corresponds with a different colour.
- The scale along the bottom of the diagram is marked in nanometres with the corresponding colours shown above.
Remember that:
- Objects appear to be different colours to an observer depending on the wavelengths they reflect.
- The name given to light that contains all wavelengths of the visible spectrum is white light.
- When all wavelengths contained in white light reflect off a neutral coloured surface then the object appears white to an observer.
- When one or several bands of wavelengths reflect off a neutral coloured surface then the object appears coloured to an observer.
- The colour an observer sees depends on the wavelengths of visible light emitted by a light source and on which of those wavelengths are reflected off an object.
- Although a human observer can distinguish between many thousands of wavelengths of light in the visible spectrum our brains often produce the impression of bands of colour.
Some key terms
The electromagnetic spectrum includes electromagnetic waves with all possible wavelengths of electromagnetic radiation, ranging from low-energy radio waves through visible light to high-energy gamma rays.
- There are no precisely defined boundaries between the bands of electromagnetic radiation in the electromagnetic spectrum.
- The electromagnetic spectrum includes, in order of increasing frequency and decreasing wavelength: radio waves, microwaves, infrared radiation, visible light, ultraviolet radiation, X-rays and gamma rays.
- Visible light is only a very small part of the electromagnetic spectrum.
Wavelength measures a complete wave cycle, which is the distance from any point on a wave to the corresponding point on the next wave.
- While wavelength can be measured from any point on a wave, it is often simplest to measure from the peak of one wave to the peak of the next or from the bottom of one trough to the bottom of the next, ensuring the measurement covers the whole of the cycle.
- The wavelength of an electromagnetic wave is usually given in metres.
- The wavelength of visible light is typically measured in nanometres, with 1,000,000,000 nanometres making up a metre.
- Radio waves, visible light, and gamma waves for example, each have different ranges of wavelengths within the electromagnetic spectrum.
A rainbow is an optical effect produced by illuminated droplets of water. Rainbows are caused by reflection, refraction (bending) and dispersion (spreading out) of light in individual droplets and result in the appearance of an arc of spectral colours.
- Atmospheric rainbows only appear when weather conditions are ideal and an observer is in the right place at the right time.
- Waterfalls, lawn sprinklers and other things that produce air-borne water droplets can produce a rainbow.
- An atmospheric rainbow is formed from countless individual droplets each of which reflects and refracts a tiny coloured image of the Sun towards the observer.
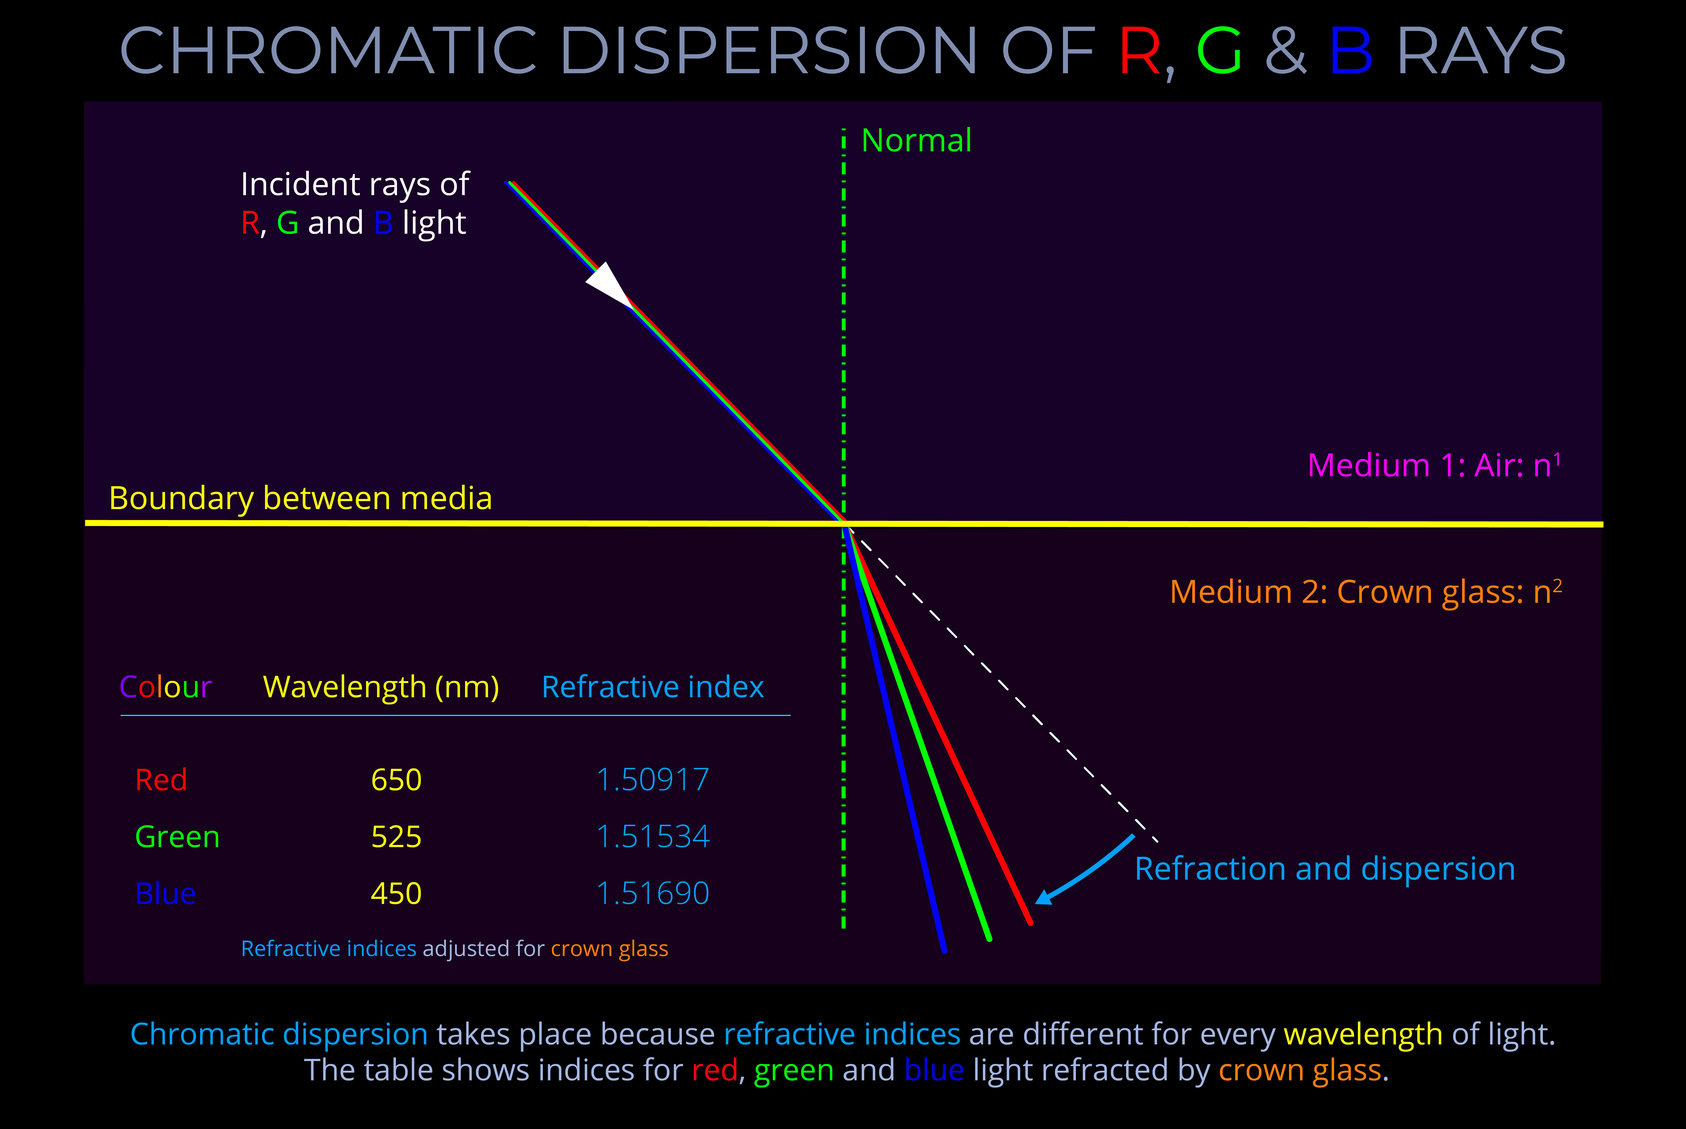
- As white light passes through water droplets, refraction causes the light to disperse and separate into the different colours seen by an observer.
- If the sun is behind an observer then the rainbow will appear in front of them.
- When a rainbow is produced by sunlight, the angles between the sun, each droplet and the observer determine which ones will form part of the rainbow, the colour each droplet will produce and the sequence in which they appear.
ROYGBV are the initials for the sequence of colours that make up the visible spectrum: red, orange, yellow, green, blue, and violet.
- The visible spectrum refers to the range of colours visible to the human eye.
- White light, when passed through a prism, separates into a sequence of individual colours corresponding with ROYGBV which is the range of colours visible to the human eye.
- White light separates into ROYGBV because different wavelengths of light bend at slightly different angles as they enter and exit the prism.
- ROYGBV helps us remember the order of these spectral colours starting from the longest wavelength (red) to the shortest (violet).
- A rainbow spans the continuous range of spectral colours that make up the visible spectrum.
- The visible spectrum is the small band of wavelengths within the electromagnetic spectrum that corresponds with all the different colours we see in the world.
- The fact that we see the distinct bands of colour in a rainbow is an artefact of human colour vision.
Visible light refers to the range of wavelengths of electromagnetic radiation that is perceived as colour by human observers. While the range of visible light is generally considered to be 400-700 nm, the exact range of colours perceptible can vary slightly between individuals.
- Visible light is one form of electromagnetic radiation. Other forms of electromagnetic radiation include radio waves, microwaves, infrared, ultraviolet, X-rays, and gamma rays. Visible light ranges from approximately 400 nanometres (nm) for violet to 700 nm for red.
- A human observer perceives visible light as a combination of all the spectral colours between red and violet, as well as a vast range of other colours produced from the blending of different wavelengths in varying proportions.
Visible light is the range of wavelengths of electromagnetic radiation perceived as colour by human observers.
- Visible light is a form of electromagnetic radiation.
- Other forms of electromagnetic radiation include radio waves, microwaves, infrared, ultraviolet, X-rays, and gamma rays.
- Visible light is perceived by a human observer as all the spectral colours between red and violet plus all other colours that result from combining wavelengths together in different proportions.
- A spectral colour is produced by a single wavelength of light.
- The complete range of colours that can be perceived by a human observer is called the visible spectrum.
- The range of wavelengths that produce visible light is a very small part of the electromagnetic spectrum.
White light is the term for visible light that contains all wavelengths of the visible spectrum at equal intensities.
- The sun emits white light because sunlight contains all the wavelengths of the visible spectrum in roughly equal proportions.
- Light travelling through a vacuum or a medium is termed white light if it includes all wavelengths of visible light.
- Light travelling through a vacuum or air is not visible to our eyes unless it interacts with something.
- The term white light can have two meanings:
- It can refer to a combination of all wavelengths of visible light travelling through space, regardless of observation.
- What a person sees when all colours of the visible spectrum hit a white or neutral-coloured surface.


