Comparing Wavelengths of Red & Violet
£0.00
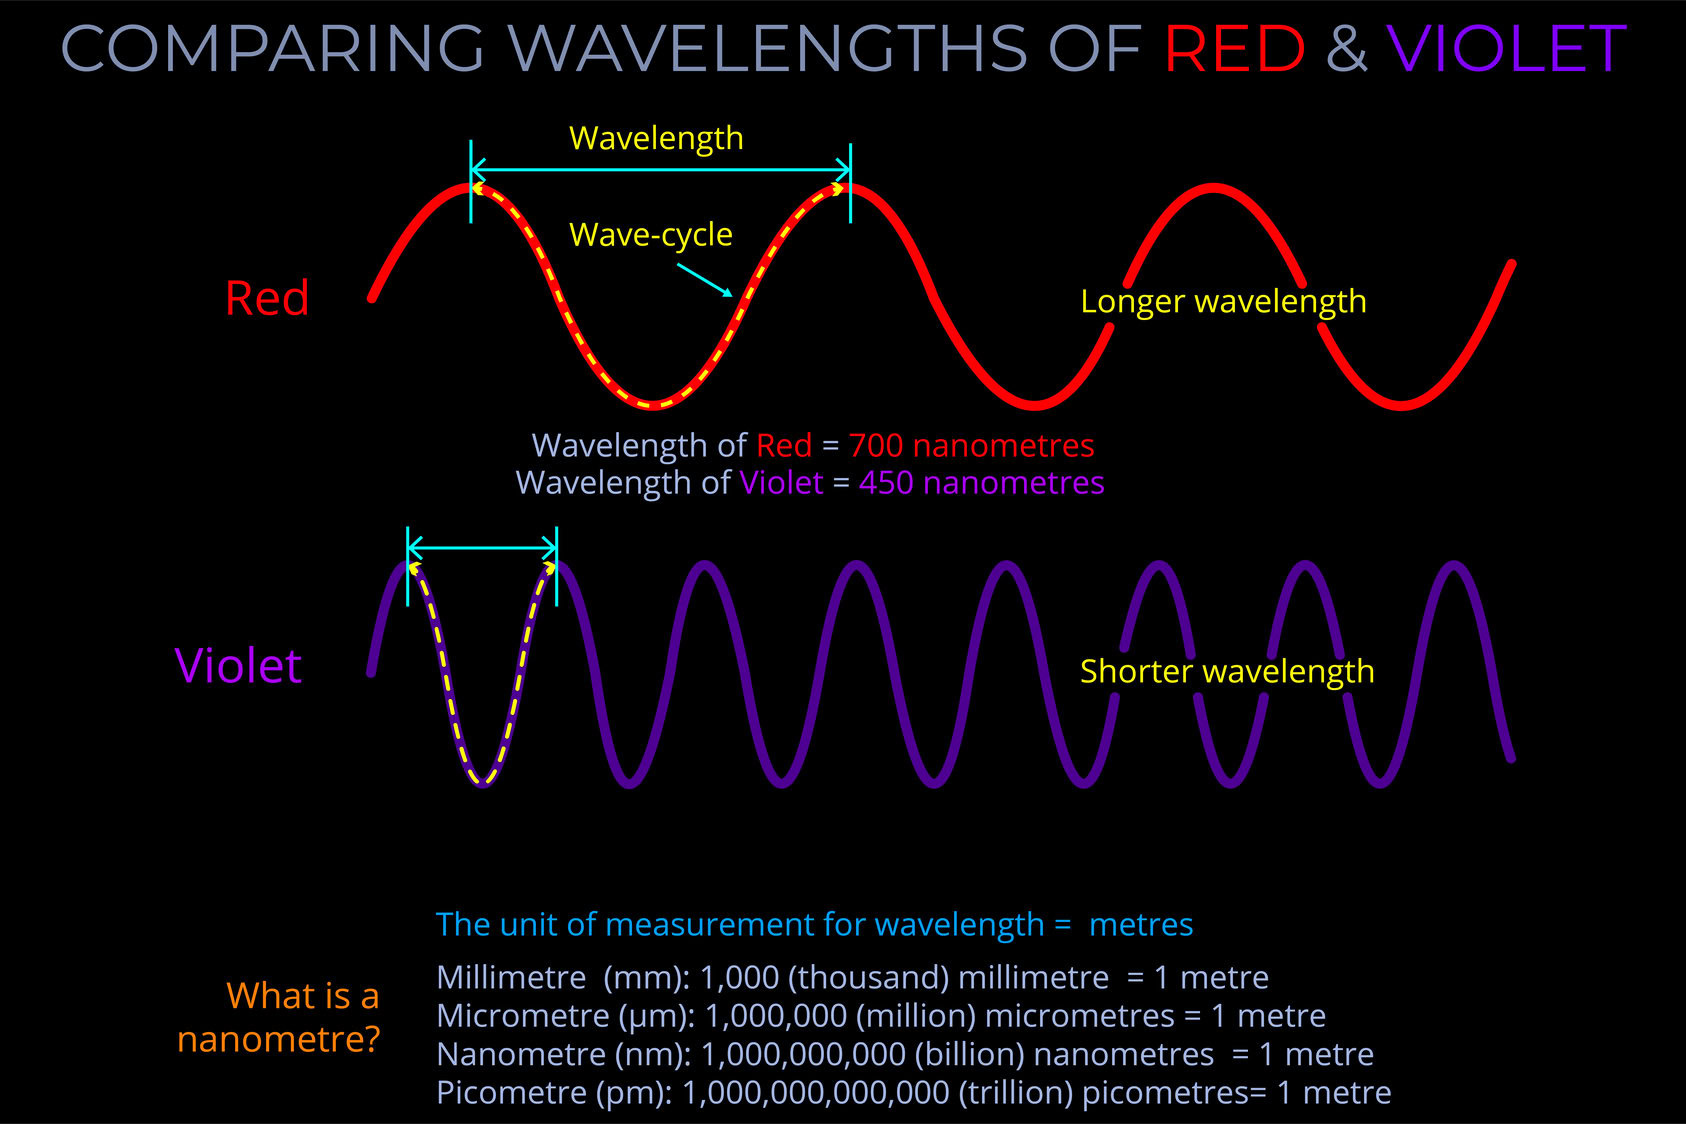
This diagram compares the wavelength of two electromagnetic waves that correspond with an observer’s perception of red and violet.
- The diagram also looks at the units used when wavelength is being measured.
- Notice that the wavelength of the red wave is much longer than the violet wave.
- The wave cycle is measured from peak to peak and is marked by the dotted line.
- The amplitude of both waves is the same.
- Because the wavelength of the violet wave is shorter than the red its frequency is higher.
- The unit of measurement of wavelength is the metre.
- Because the wavelength of electromagnetic waves is so small, metres are sub-divided into micrometres, nanometres and picometres.
- The number of each unit per metre is shown on the diagram.
Description
Comparing Wavelengths of Red & Violet
TRY SOME QUICK QUESTIONS AND ANSWERS TO GET STARTED
About the diagram
About the diagram
- This diagram compares the wavelength of two electromagnetic waves that correspond with an observer’s perception of red and violet.
- The diagram also looks at the units used when wavelength is being measured.
- Notice that the wavelength of the red wave is much longer than the violet wave.
- The wave cycle is measured from peak to peak and is marked by the dotted line.
- The amplitude of both waves is the same.
- Because the wavelength of the violet wave is shorter than the red its frequency is higher.
- The unit of measurement of wavelength is the metre.
- Because the wavelength of electromagnetic waves is so small, metres are sub-divided into micrometres, nanometres and picometres.
- The number of each unit per metre is shown on the diagram.
Remember that:
- The position of an electromagnetic wave within the electromagnetic spectrum is determined by its frequency or wavelength.
- The electromagnetic spectrum includes, in order of increasing frequency and decreasing wavelength: radio waves, microwaves, infrared radiation, visible light, ultraviolet radiation, X-rays and gamma rays.
- The electromagnetic spectrum includes all possible wavelengths of electromagnetic radiation, ranging from low energy radio waves through visible light up to high energy gamma rays.
- The full range of wavelengths of visible light, between red and violet, is called the visible spectrum.
Some key terms
Electromagnetic radiation is a type of energy more commonly simply called light. Detached from its source, it is transported by electromagnetic waves (or their quanta, photons) and propagates through space at the speed of light.
- Electromagnetic radiation (EM radiation or EMR) includes radio waves, microwaves, infrared, (visible) light, ultraviolet, X-rays, and gamma rays.
- Man-made technologies that produce electromagnetic radiation include radio and TV transmitters, radar, MRI scanners, microwave ovens, computer screens, mobile phones, all types of lights and lamps, electric blankets, electric bar heaters, lasers and x-ray machines.
- At the quantum scale of electromagnetism, electromagnetic radiation is described in terms of photons rather than waves. Photons are elementary particles responsible for all electromagnetic phenomena.
- The term quantum refers to the smallest quantity into which something can be divided. A quantum of a thing is indivisible into smaller units so they have no sub-structure. A photon is a quantum of electromagnetic radiation.
- A single photon with a wavelength corresponding with gamma rays might carry 100,000 times the energy of a single photon of visible light.
The electromagnetic spectrum includes electromagnetic waves with all possible wavelengths of electromagnetic radiation, ranging from low-energy radio waves through visible light to high-energy gamma rays.
- There are no precisely defined boundaries between the bands of electromagnetic radiation in the electromagnetic spectrum.
- The electromagnetic spectrum includes, in order of increasing frequency and decreasing wavelength: radio waves, microwaves, infrared radiation, visible light, ultraviolet radiation, X-rays and gamma rays.
- Visible light is only a very small part of the electromagnetic spectrum.
A nanometre (nm) is a unit of length in the metric system, equal to one billionth of a metre (1 nm = 1 × 10⁻⁹ metres). It is commonly used to measure extremely small distances, particularly at the atomic and molecular scale.
- In the context of light and electromagnetic radiation, a nanometre is often used to describe wavelengths of visible light.
The wavelength of visible light ranges from about 700 nm (red) to 400 nm (violet). - Nanometres are also used to measure components like the thickness of materials, the size of particles in nanotechnology, and the spacing between atoms in a crystal lattice.
A wave diagram is a graphic representation, using specific drawing rules and labels, that depicts variations in the characteristics of light waves. These characteristics include changes in wavelength, frequency, amplitude, speed of light and propagation direction.
- A wave diagram provides a visual representation of how a wave behaves when interacting with various media or objects.
- The purpose of a wave diagram is to illustrate optical phenomena, including reflection, refraction, dispersion, and diffraction.
- Wave diagrams can be useful in both theoretical and practical applications, such as understanding the basics of the physics of light or when designing complex optical systems.
Wavelength measures a complete wave cycle, which is the distance from any point on a wave to the corresponding point on the next wave.
- While wavelength can be measured from any point on a wave, it is often simplest to measure from the peak of one wave to the peak of the next or from the bottom of one trough to the bottom of the next, ensuring the measurement covers the whole of the cycle.
- The wavelength of an electromagnetic wave is usually given in metres.
- The wavelength of visible light is typically measured in nanometres, with 1,000,000,000 nanometres making up a metre.
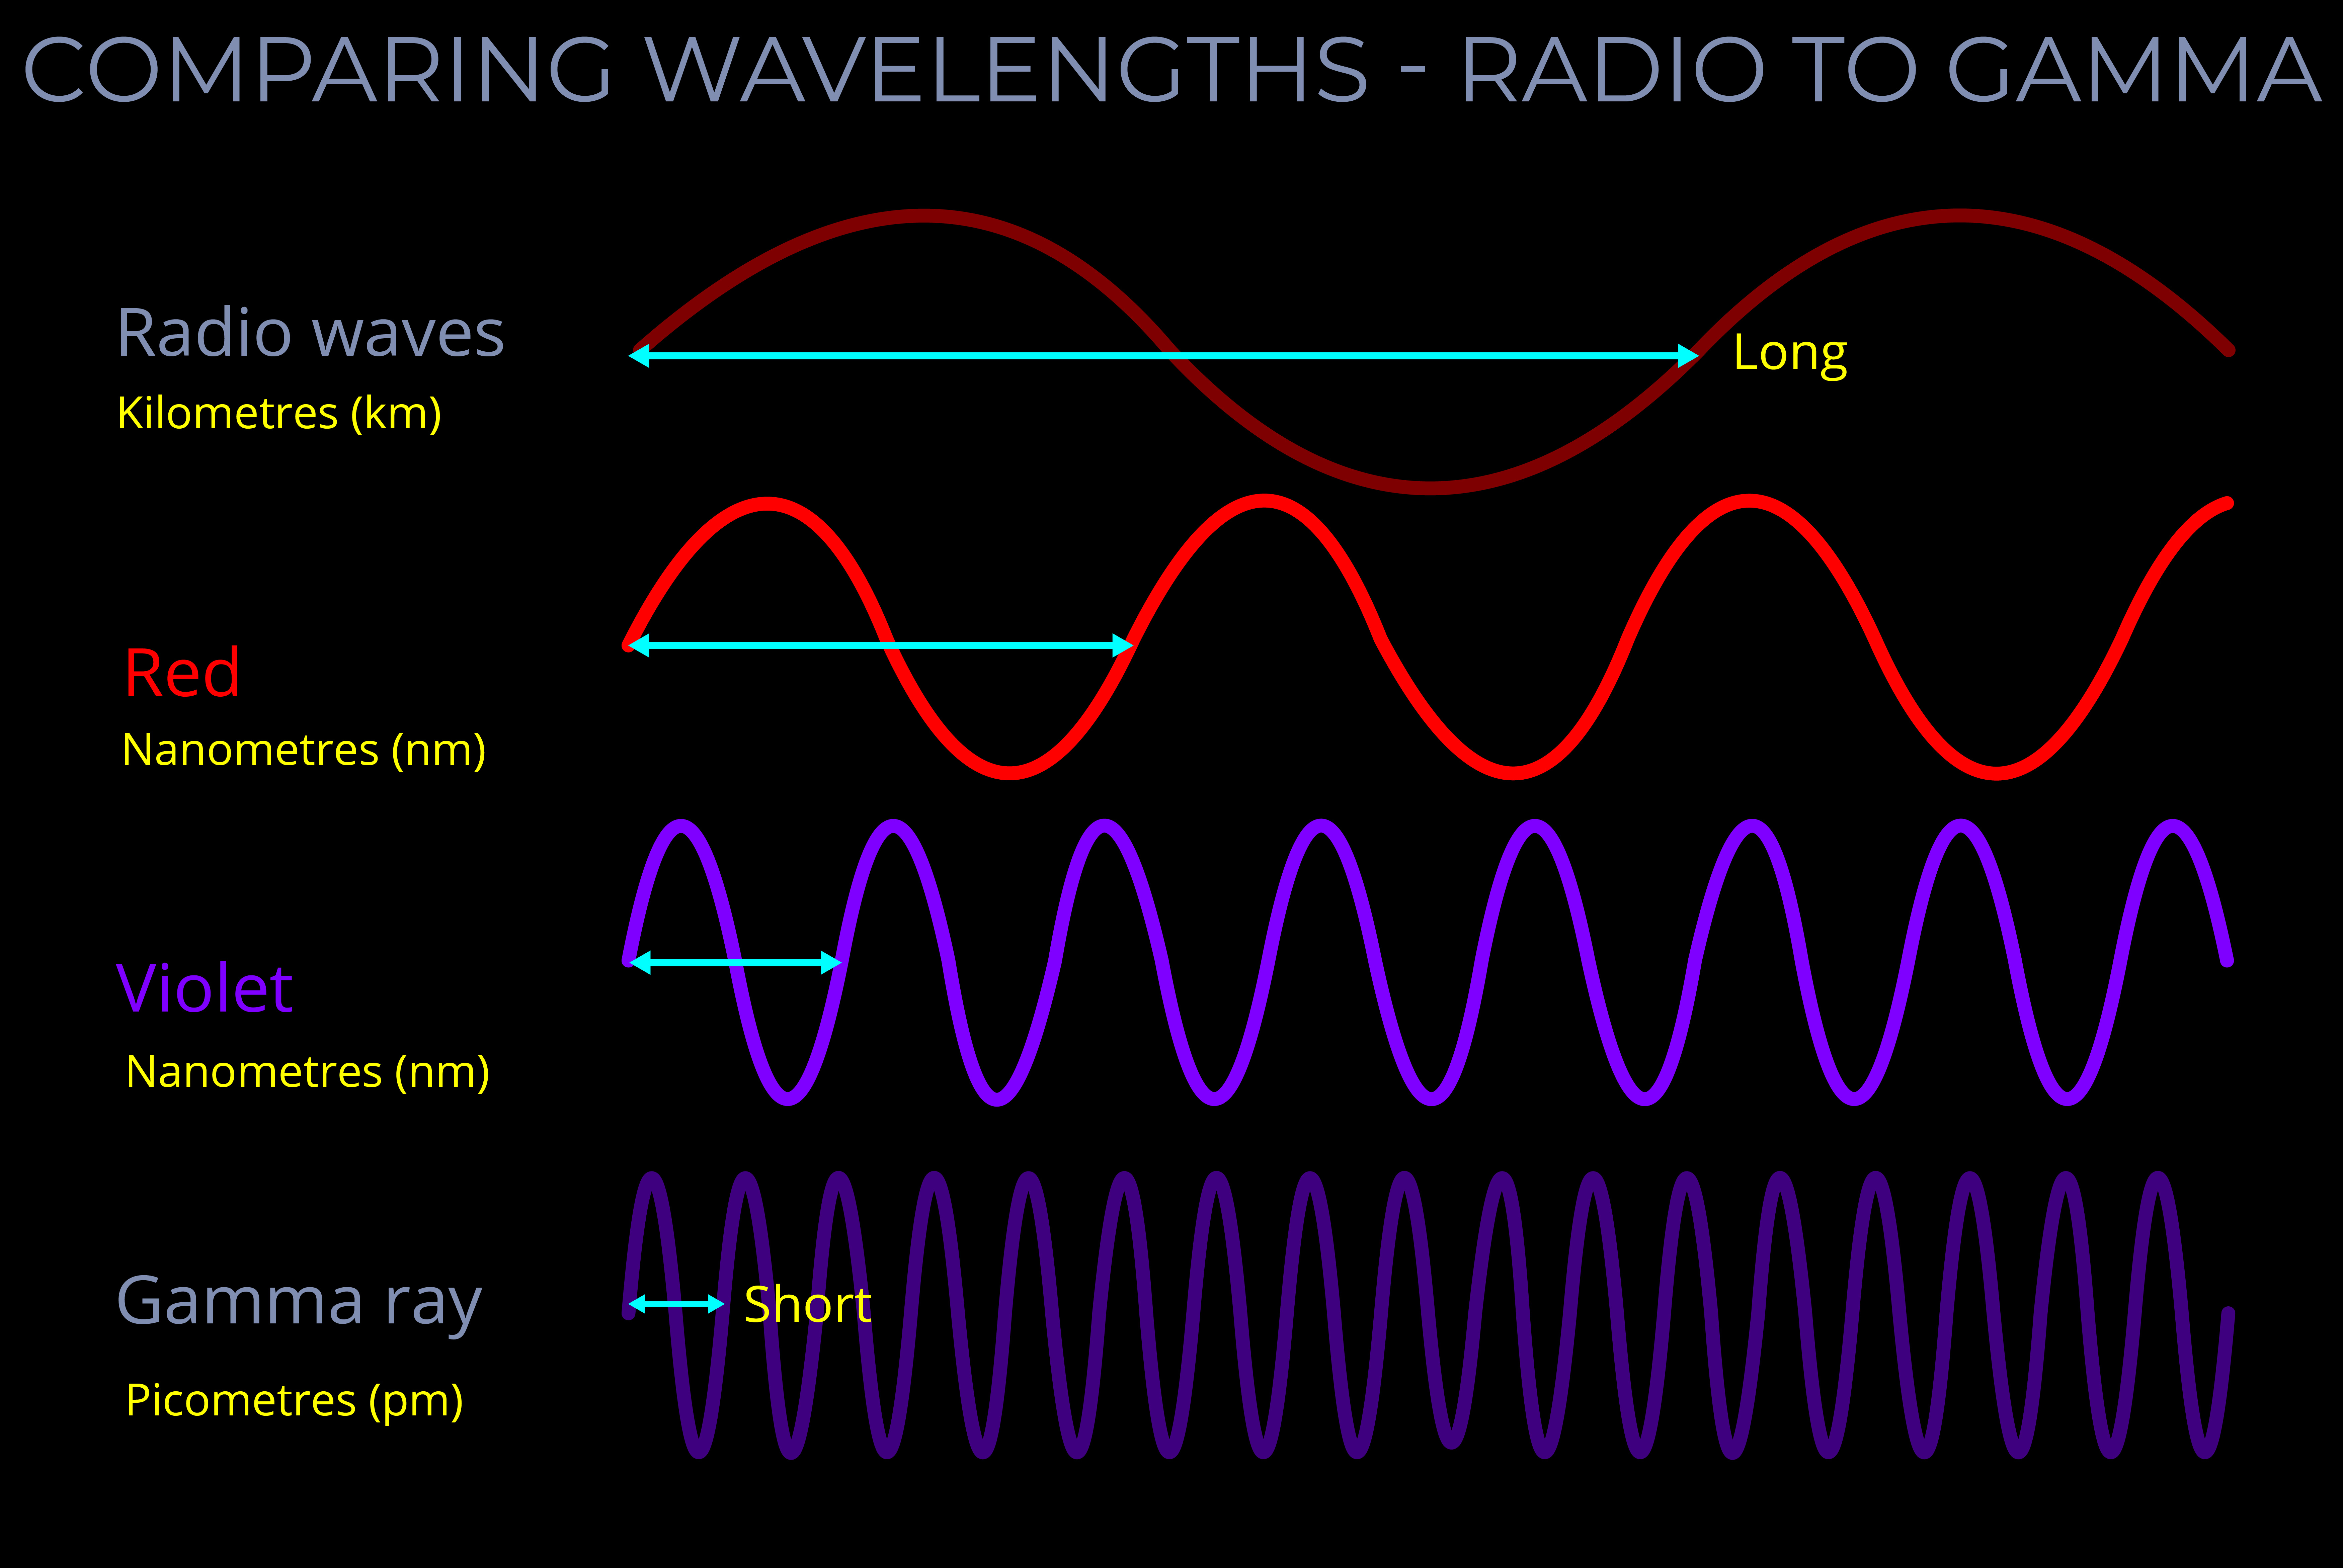
- Radio waves, visible light, and gamma waves for example, each have different ranges of wavelengths within the electromagnetic spectrum.
An electromagnetic wave carries electromagnetic radiation.
- An electromagnetic wave describes electromagnetic radiation as it propagates from a light source, travels through space and encounters different materials.
- Electromagnetic waves can be imagined as synchronised oscillations of electric and magnetic fields that propagate at the speed of light in a vacuum.
- Electromagnetic waves are similar to other types of waves in so far as they can be measured in terms of wavelength, frequency and amplitude.
- We can feel electromagnetic waves release their energy when sunlight warms our skin.
- Remember that electromagnetic radiation can be described either as an oscillating wave or as a stream of particles, called photons, which also travel in a wave-like pattern.
- The notion of waves is often used to describe phenomena such as refraction or reflection whilst the particle analogy is used when dealing with phenomena such as diffraction and interference.


