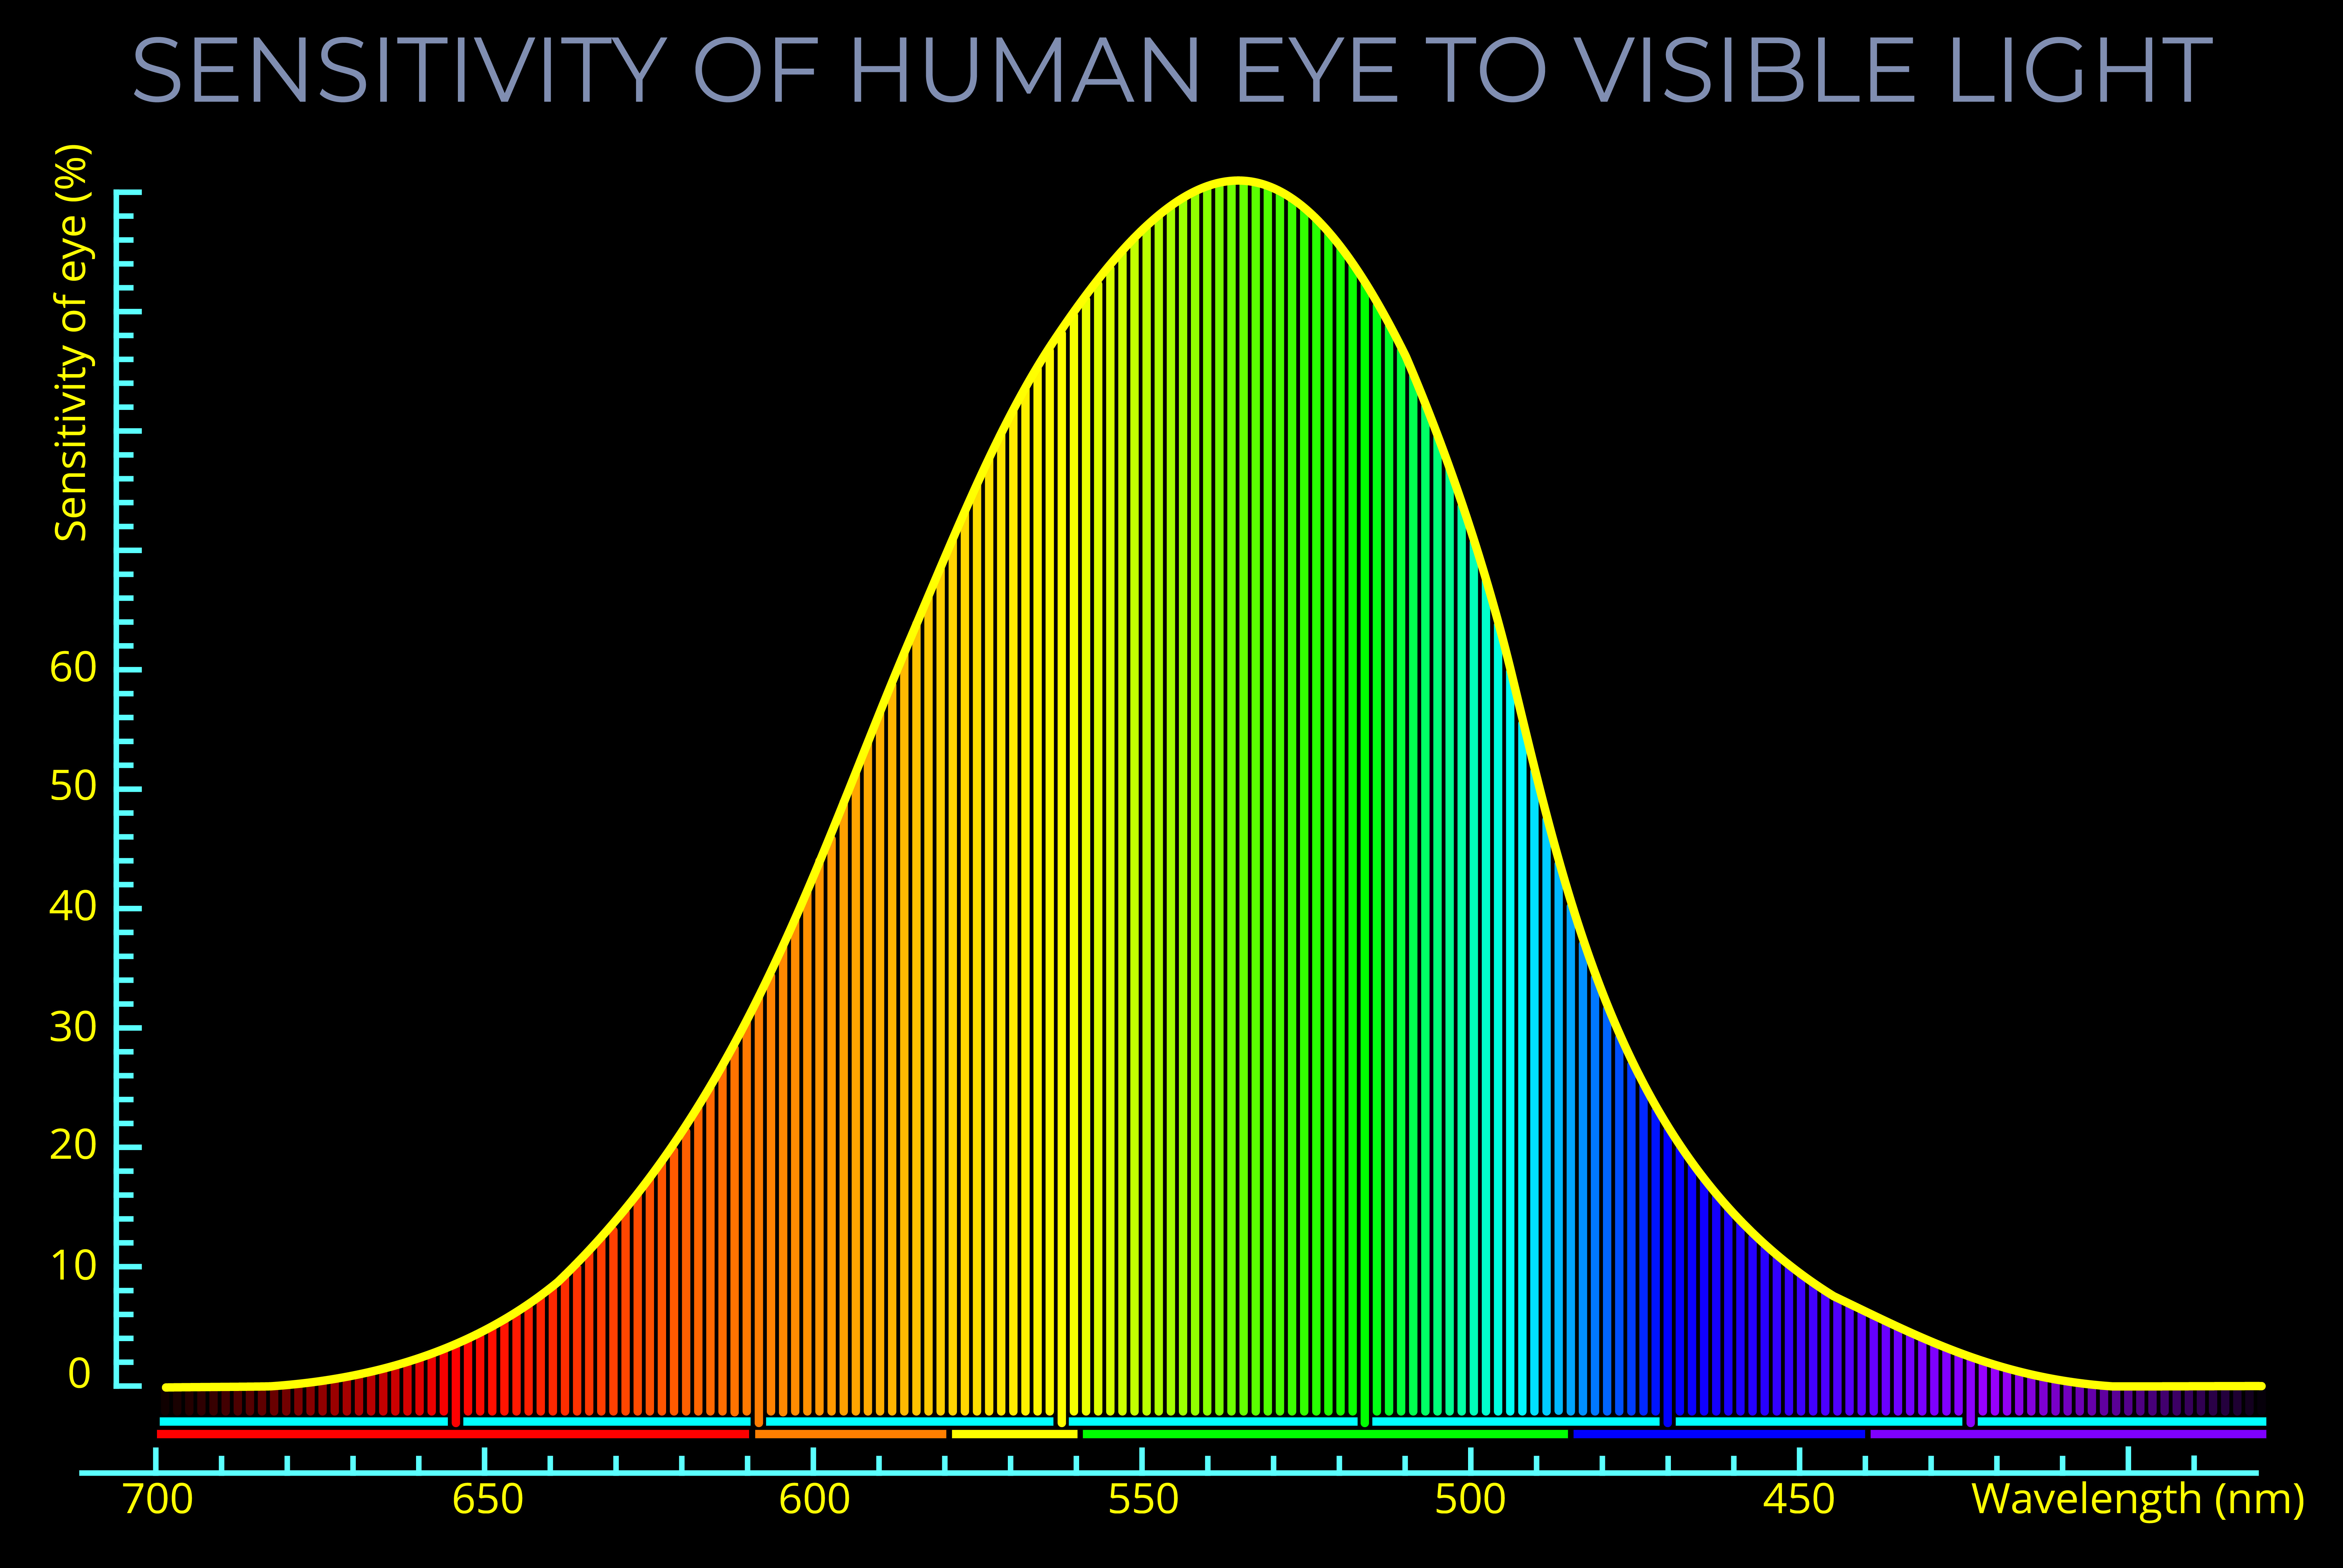
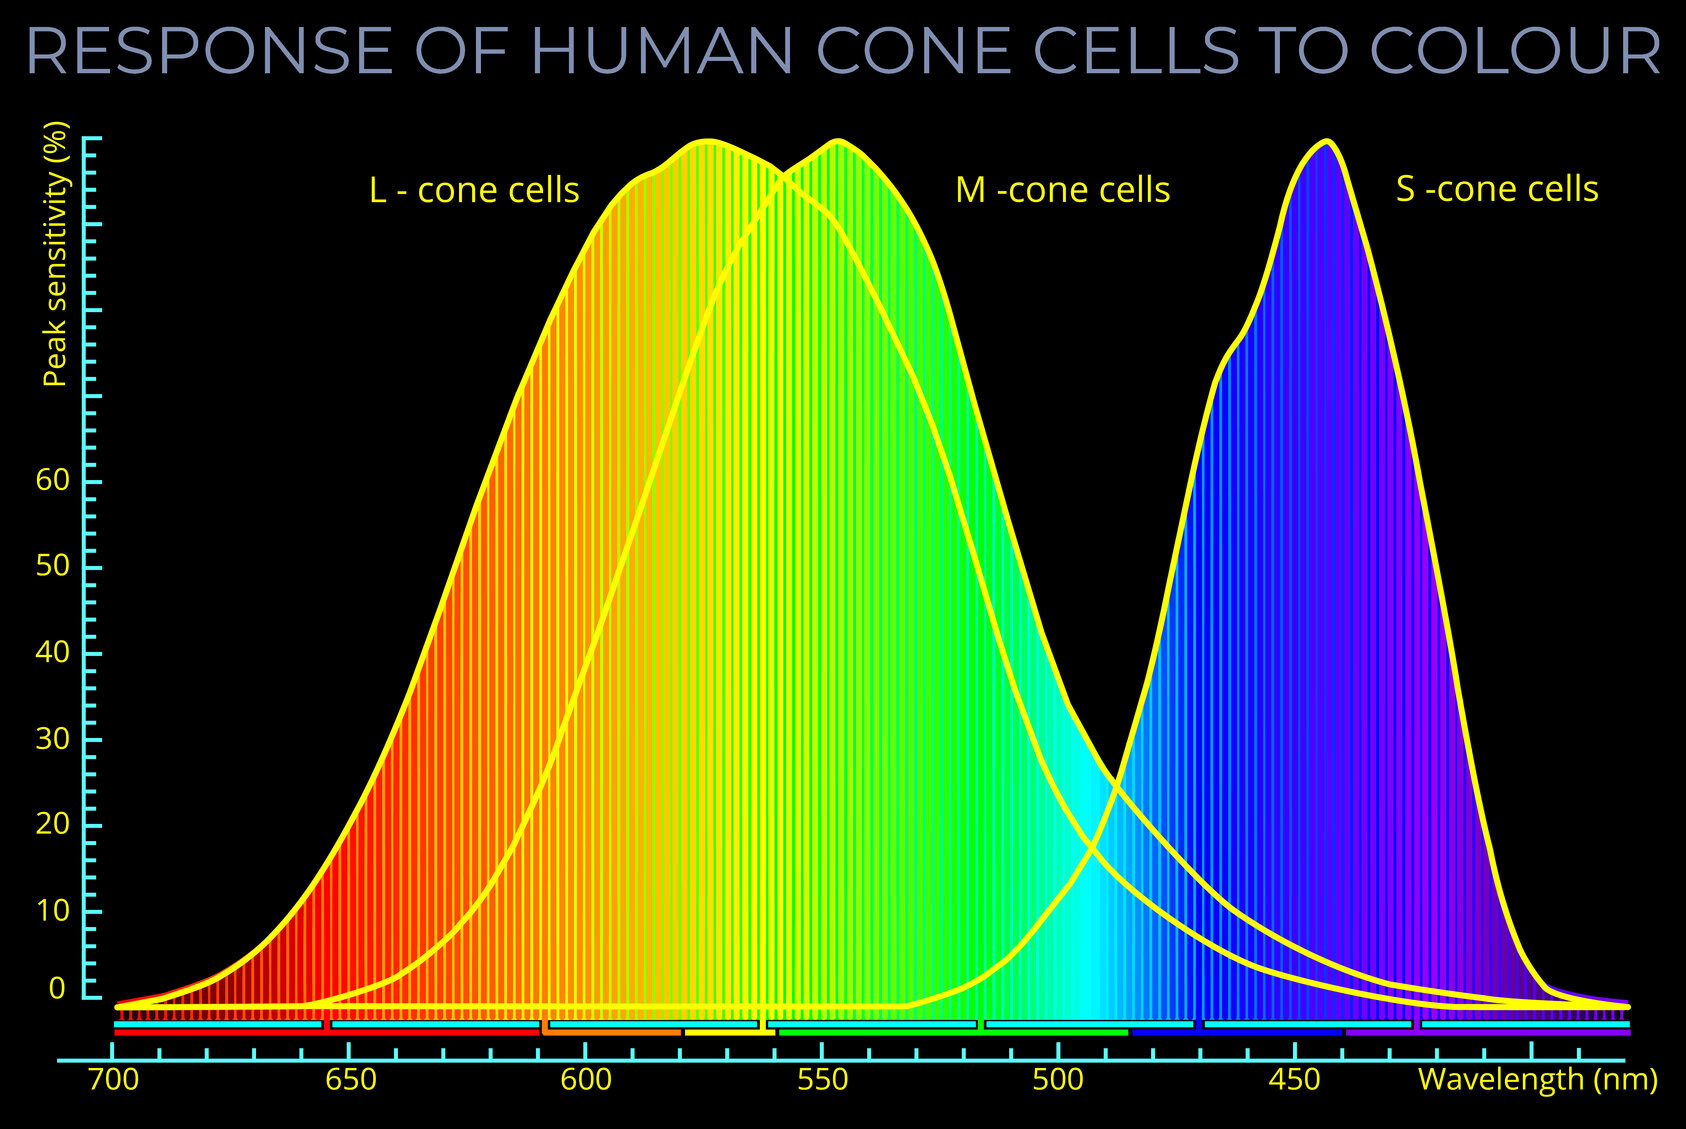
A photopic curve is a graphical representation of the sensitivity of the human eye to light under normal, bright lighting conditions. It indicates that the human eye has the strongest response to green light, with less sensitivity to the red and violet ends of the visible spectrum.
- The standard photopic curve used in the CIE 1931 colour space is based on the photopic luminosity function, which describes the average sensitivity of the human eye to different wavelengths of light under normal, bright lighting conditions.
- A photopic luminosity function is a mathematical function used to derive the photopic curve from the CIE 1931 colour space.
- The CIE 1931 colour space is a standardized system for describing colours based on human colour perception. It was developed by the International Commission on Illumination (CIE) in 1931 and is still widely used today.
- In low light conditions, the sensitivity of the human eye to light changes, and the scotopic curve is used to describe the response of the eye to light.
- Scotopic and photopic curves have different units of measurement.
- A photopic curve uses units of luminous flux, which is a measure of the total amount of visible light emitted by a source.
- A scotopic curve, on the other hand, uses units of luminous intensity, which is a measure of the brightness of a light source per unit of solid angle.


