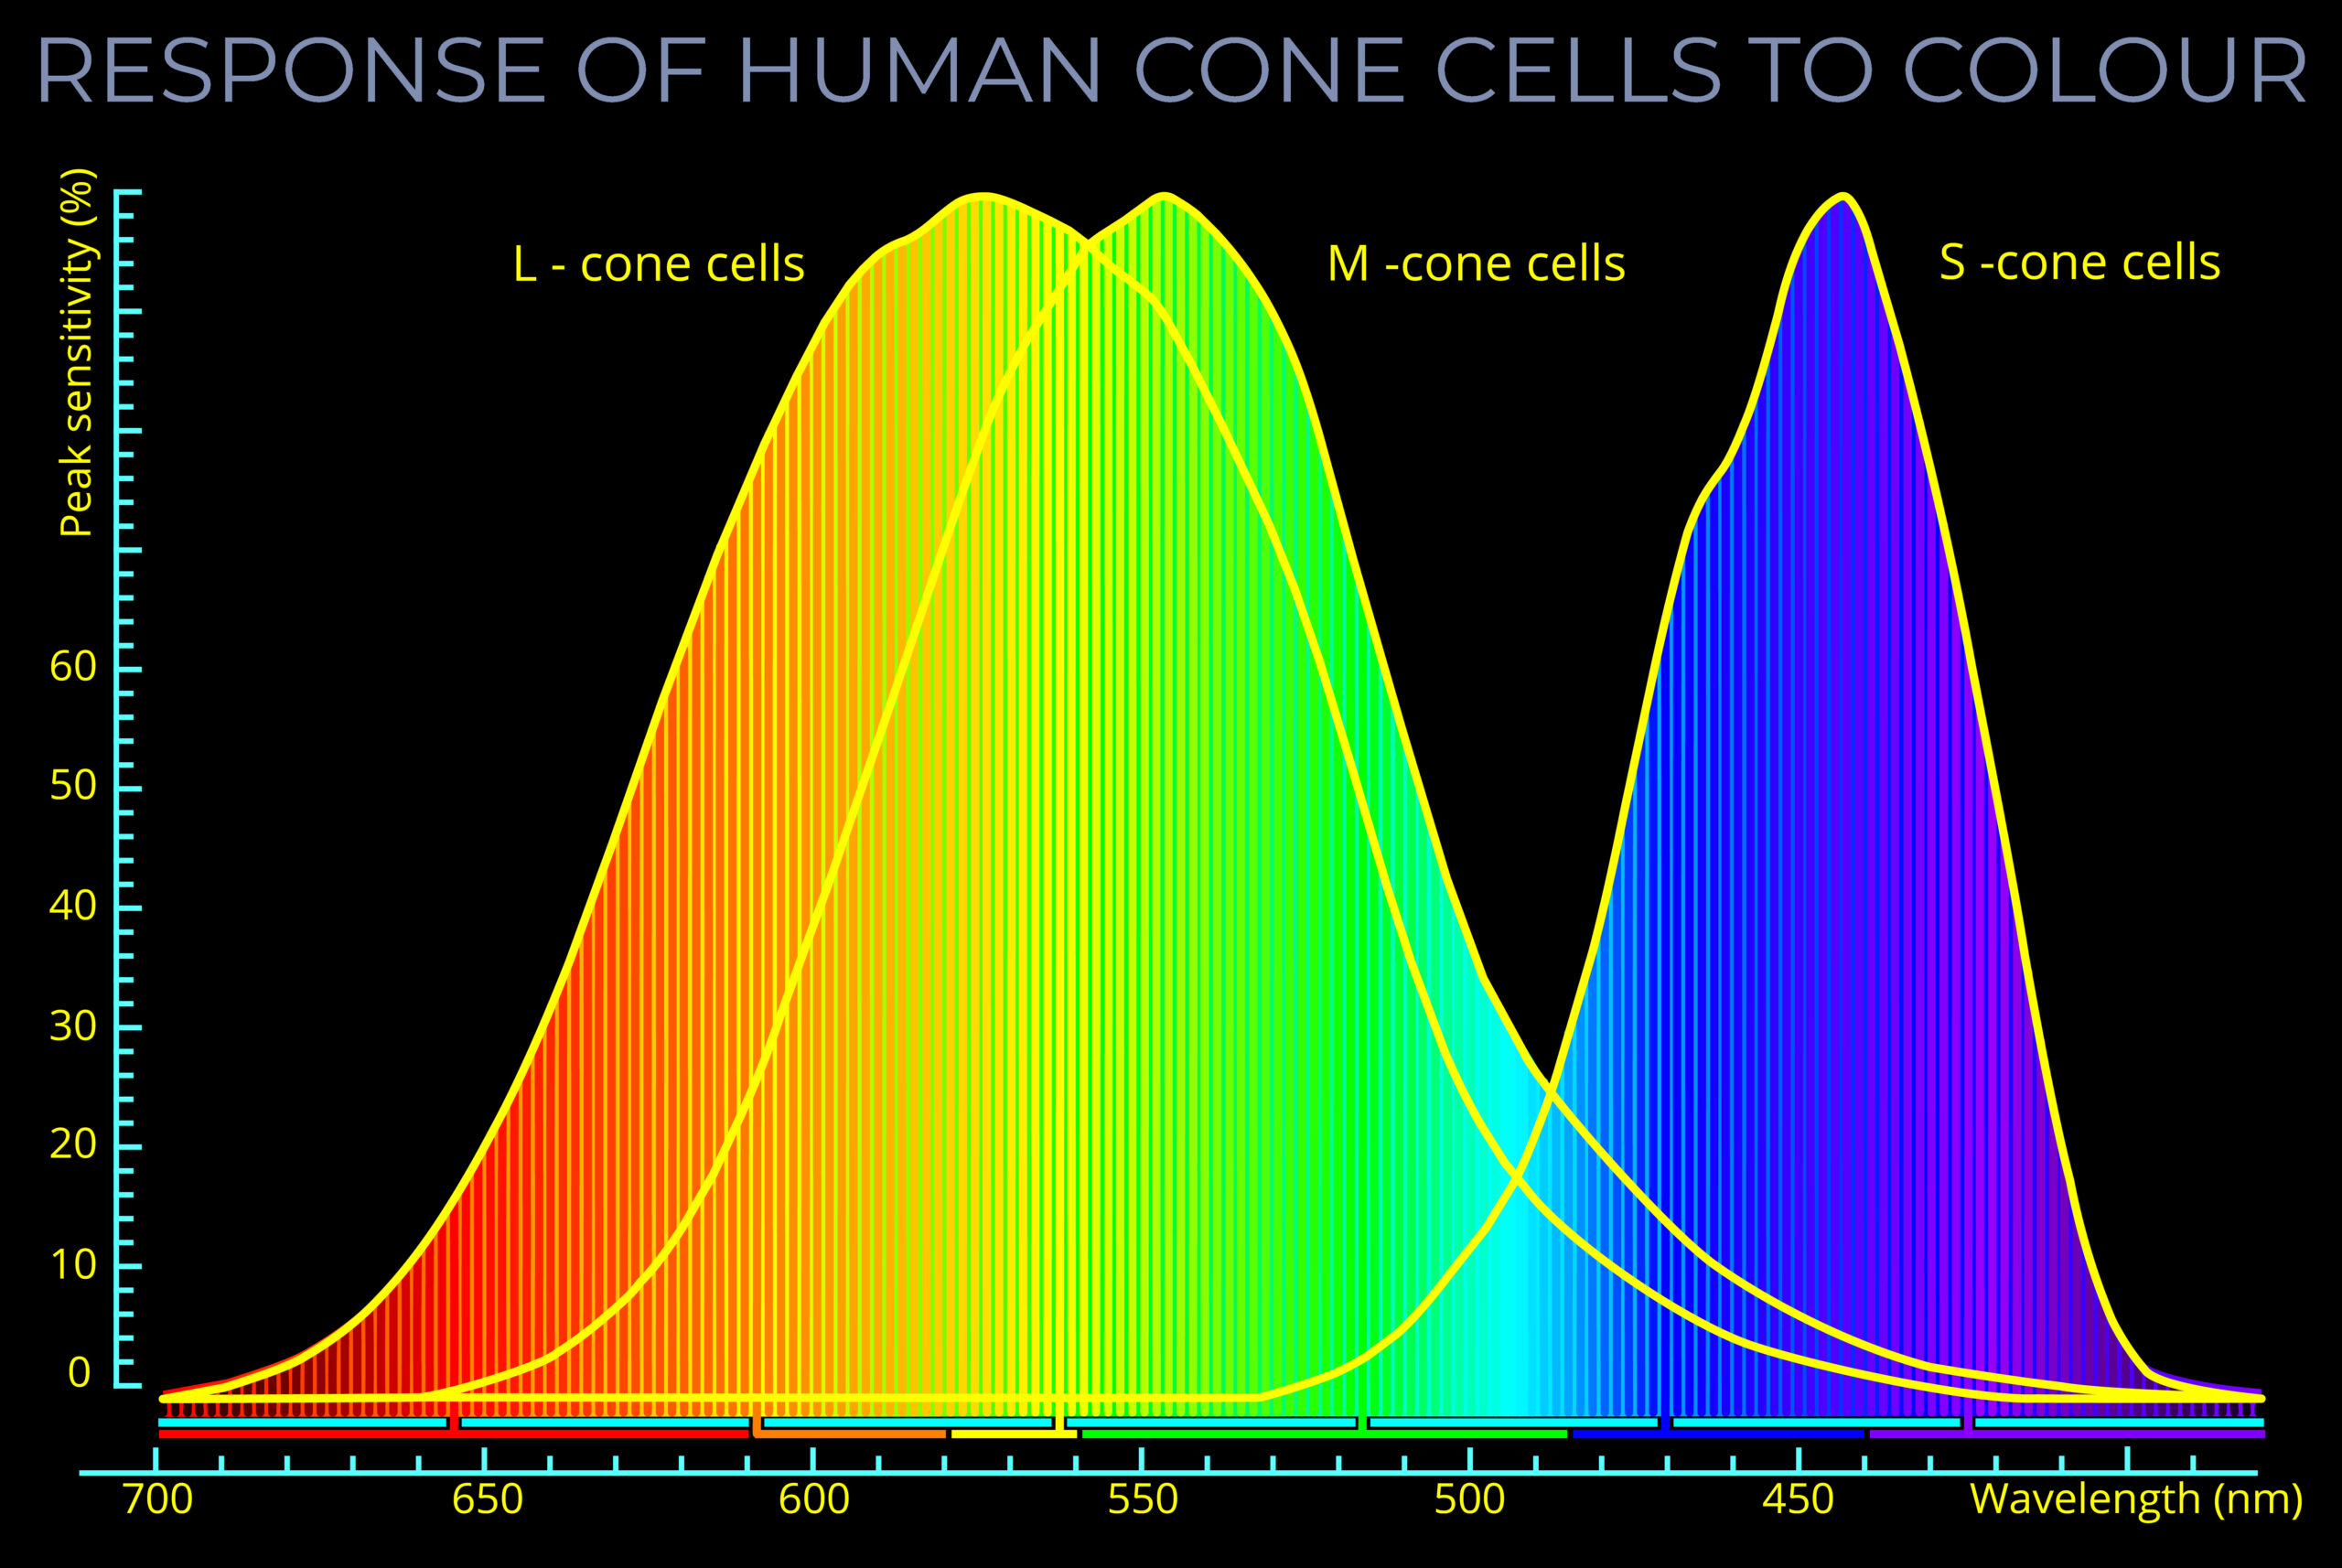
- A scotopic curve is like a line graph that shows how sensitive the human eye is to light under low-light conditions.
- A scotopic curve is an important way to understand night vision.
- The curve shows the minimum amount of light needed for the eye to detect light at different colours and their corresponding wavelengths.
- This information comes from the response of our rod cells, which are more active in low light than the cones that dominate in bright light.
- Unlike the photopic curve, which peaks at around green-yellow light, the scotopic curve peaks at blue-green light, which means our eyes are most sensitive to these colours in low light.
- It’s interesting to note that scotopic and photopic curves use different units to measure light.
- The photopic curve uses a unit similar to overall brightness.
- The scotopic curve uses a unit related to light intensity per unit area (such as brightness per square degree).
- A scotopic curve is a graphical representation of the sensitivity of the human eye to light under low-light conditions, such as at night or in very dimly lit environments.
- A scotopic curve is like a line graph that shows how sensitive the human eye is to light under low-light conditions.
- A scotopic curve is an important way to understand night vision.
- The curve shows the minimum amount of light needed for the eye to detect light at different colours and their corresponding wavelengths.
- This information comes from the response of our rod cells, which are more active in low light than the cones that dominate in bright light.


