Chromaticity refers to the characteristic of colour when described in terms of hue and saturation, rather than just its wavelength.
- Chromaticity refers to the quality of a colour that sets it apart from white, grey, or black.
- The chromaticity of different colours is often described by chromaticity coordinates that define where a colour appears within a colour space.
- The simplest way to understand chromaticity is through a chromaticity diagram that creates a two-dimensional visual display of all the colours produced by a specific colour space.
- A chromaticity diagram displays hue and saturation without mentioning their brightness.
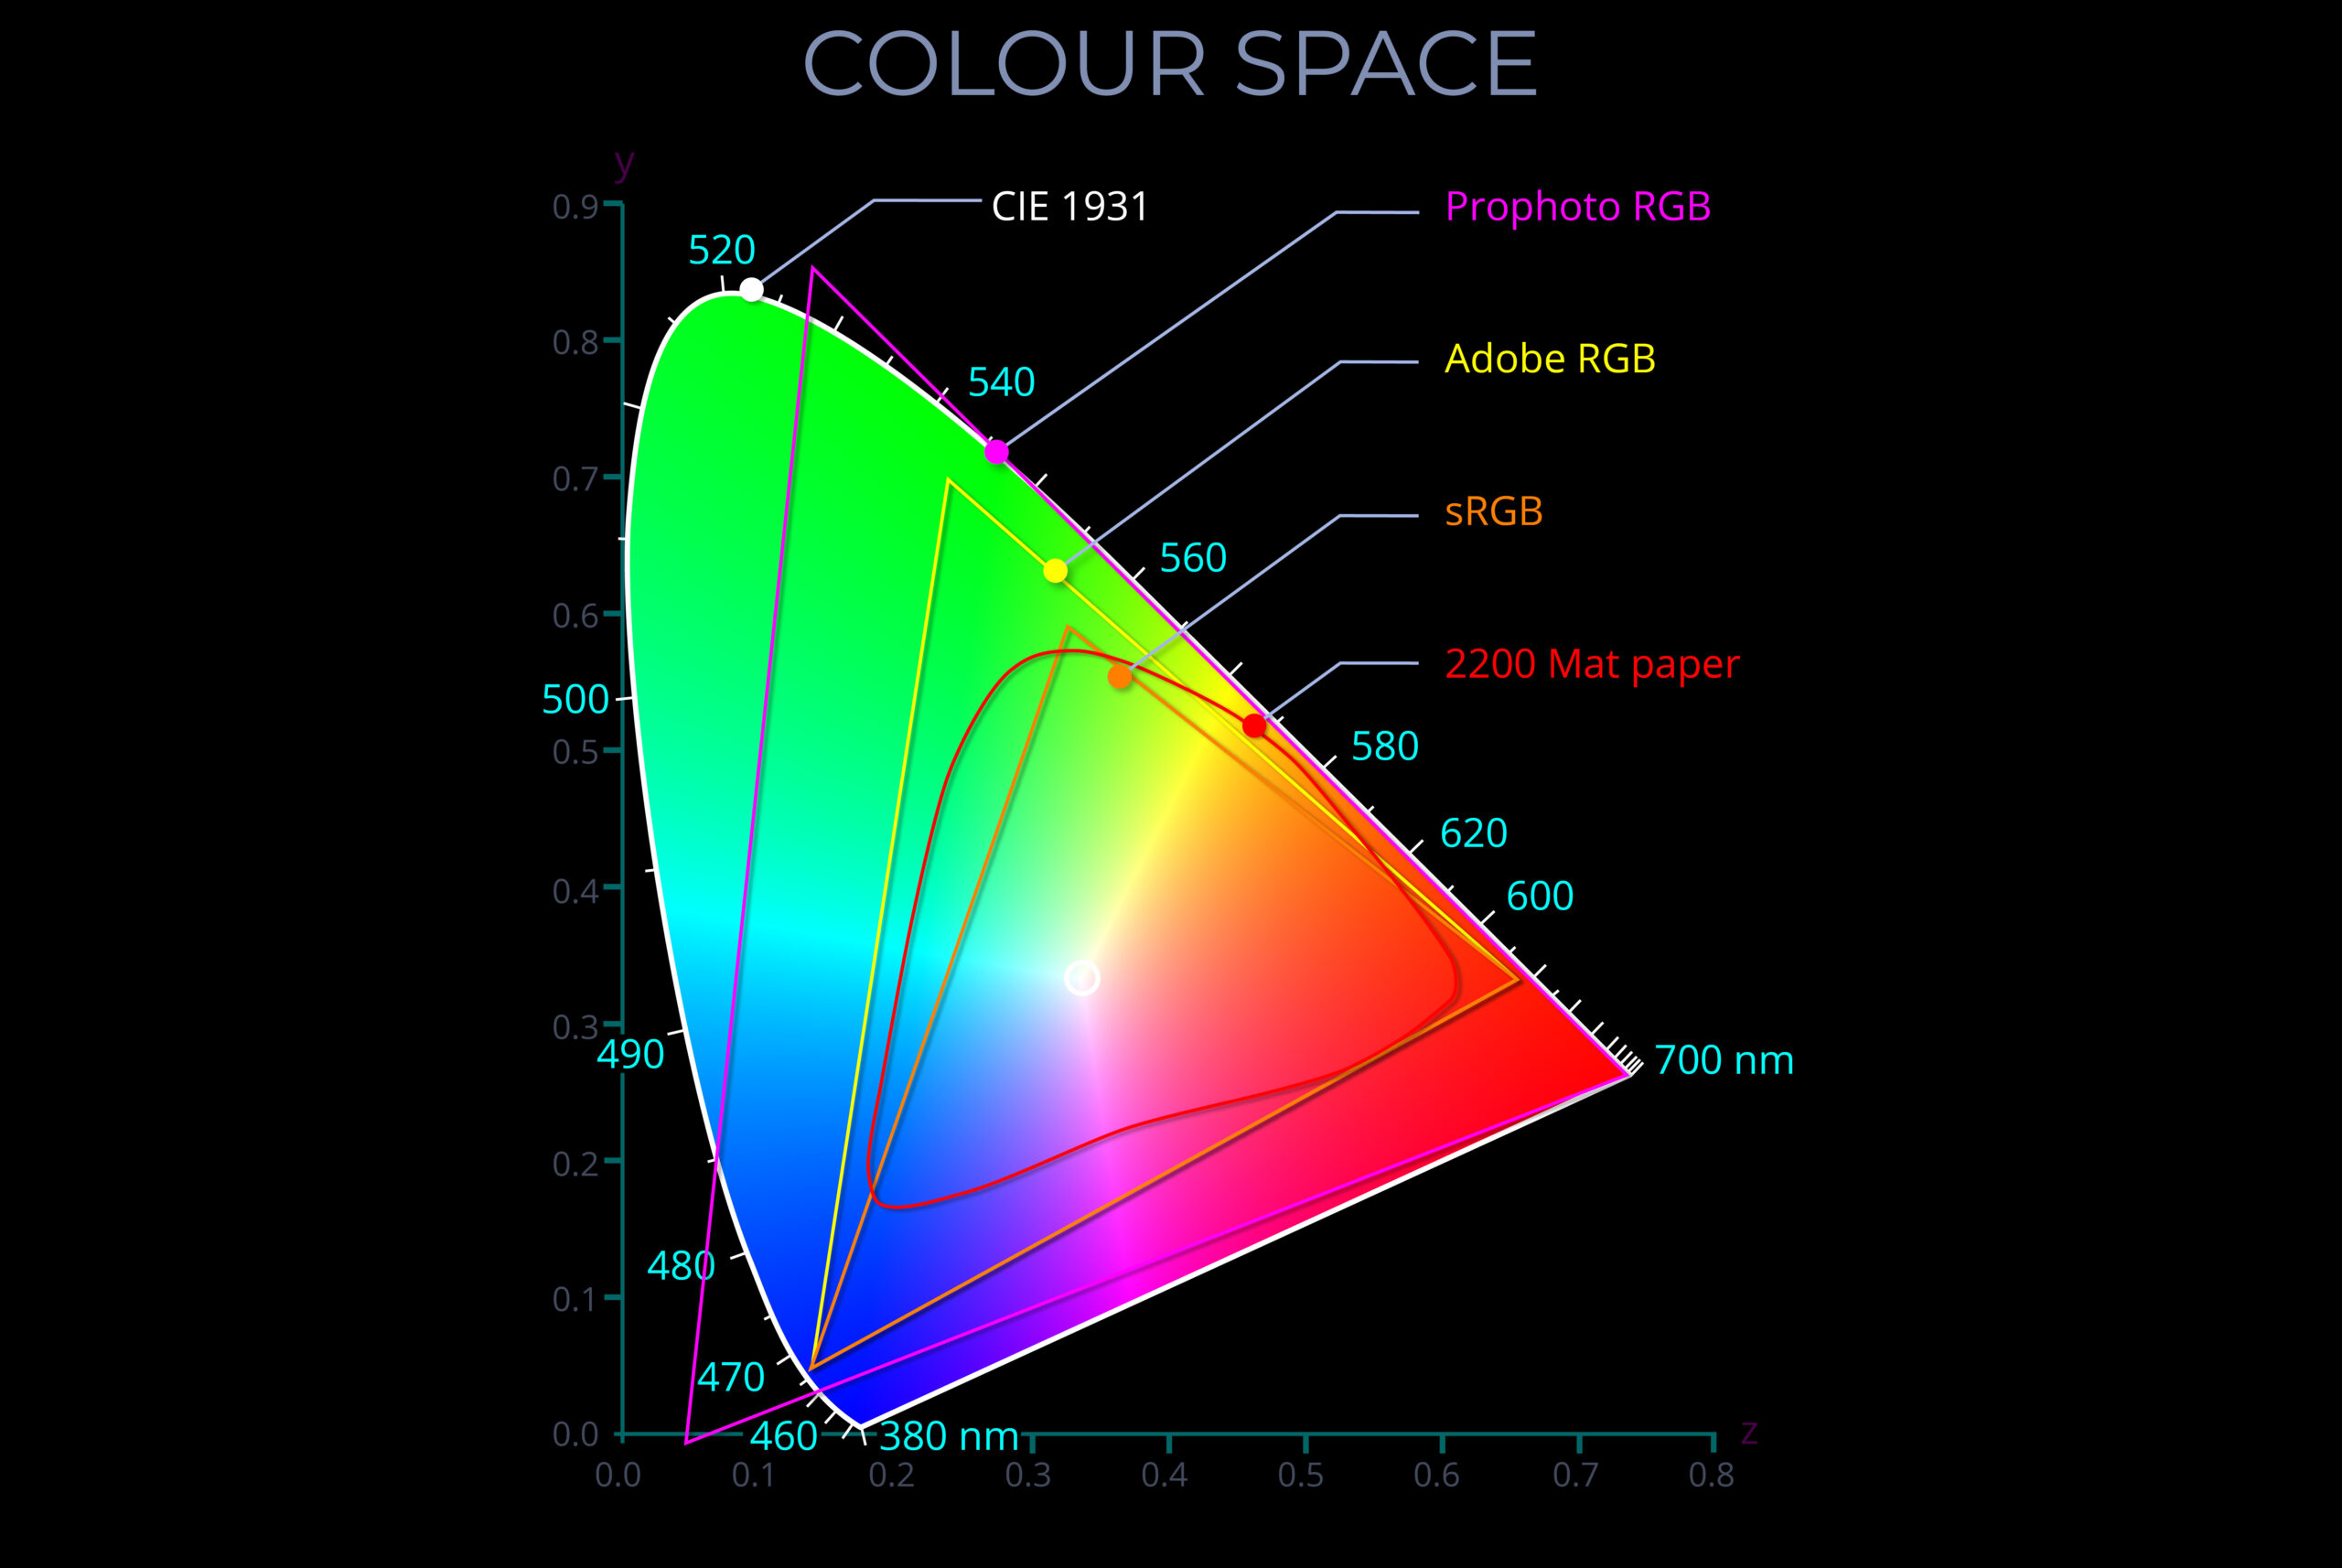
- The most common chromaticity diagrams showcase the full range of colours visible to a human observer under ideal conditions. The position of each colour is plotted using the range of colour values (chromaticity coordinates) described by the CIE (1931) XYZ colour space.
- Some chromaticity diagrams illustrating the CIE (1931) XYZ colour space include overlays of the smaller gamuts of colour spaces associated with different mediums, lighting conditions, and devices.
- Examples of colour spaces with smaller gamuts than the CIE (1931) XYZ colour space include:
- Adobe RGB (1998)
- Prophoto RGB
- sRGB
- 2200 matt paper
Chromaticity diagram
Related diagrams
Each diagram below can be viewed on its own page with a full explanation.