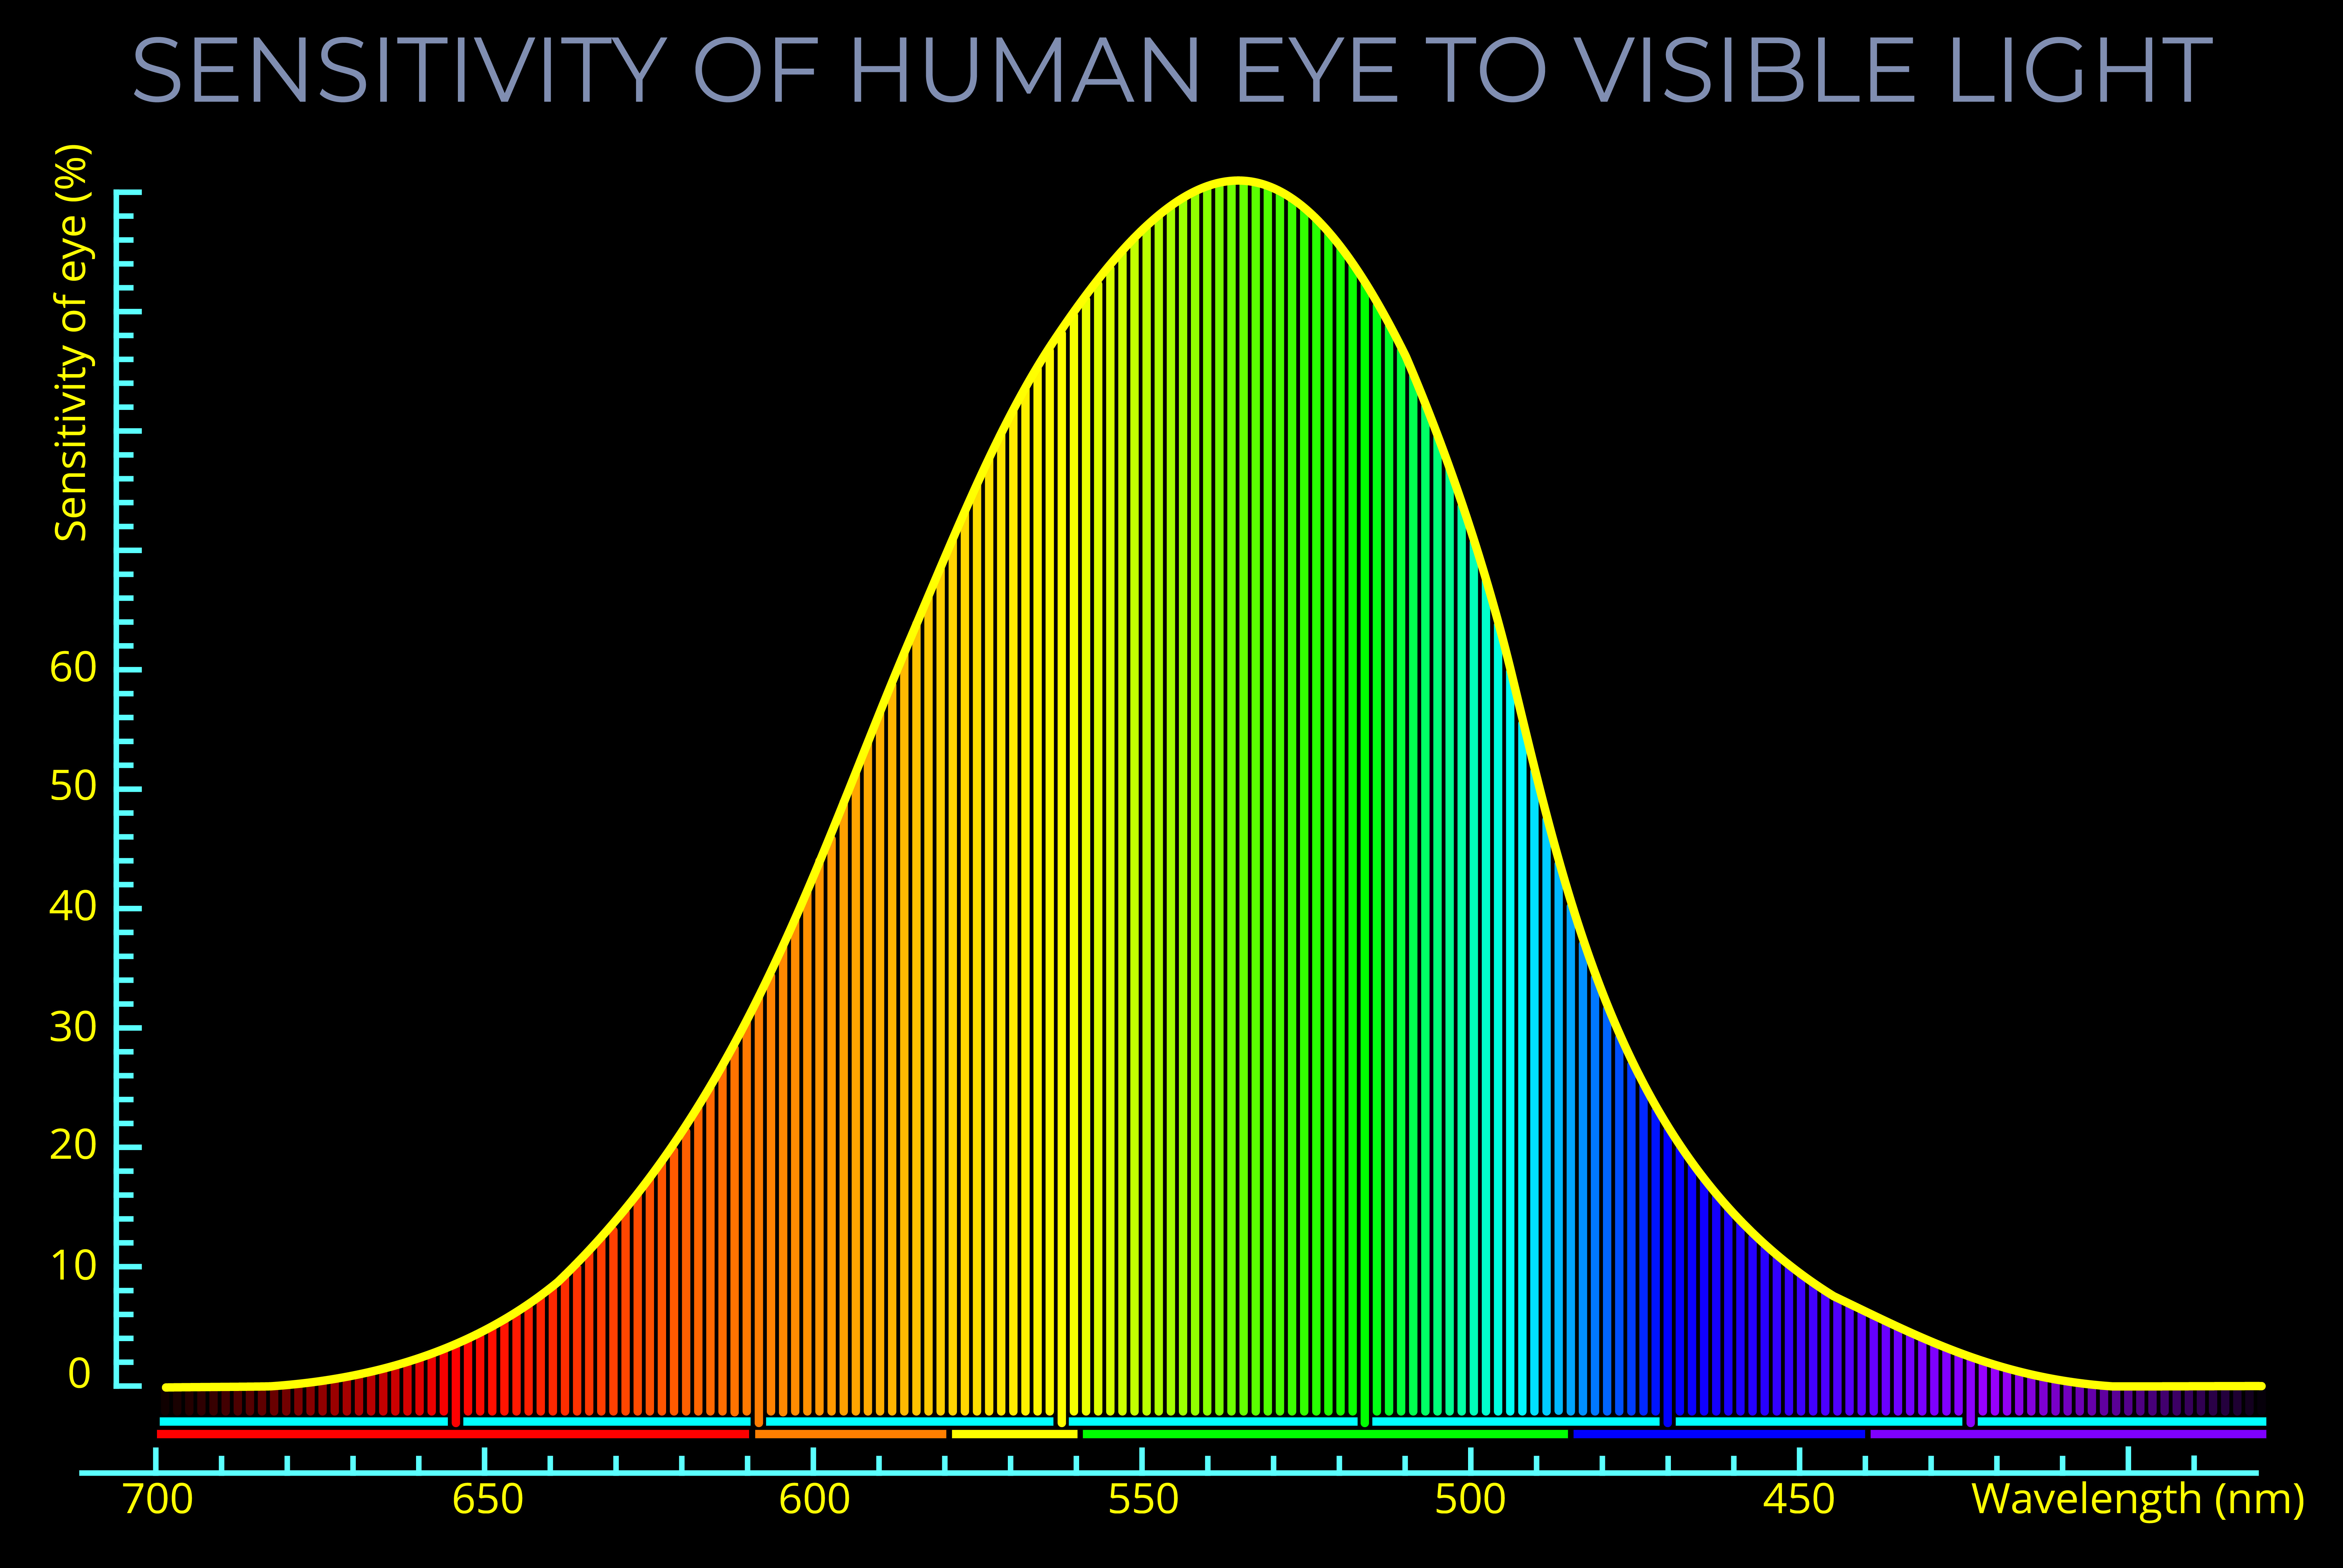
The spectral power distribution (SPD) provides a detailed profile of the light emitted or reflected by a source across the visible spectrum, typically represented as a graph where the x-axis shows the wavelength (or frequency) and the y-axis shows the intensity or power at each wavelength.
- Spectral power distribution is usually measured with a spectroscope. These instruments break down the light into its constituent wavelengths, allowing for precise analysis of the light’s spectral composition. This helps with understanding the exact colour of a light source or how it interacts with materials.
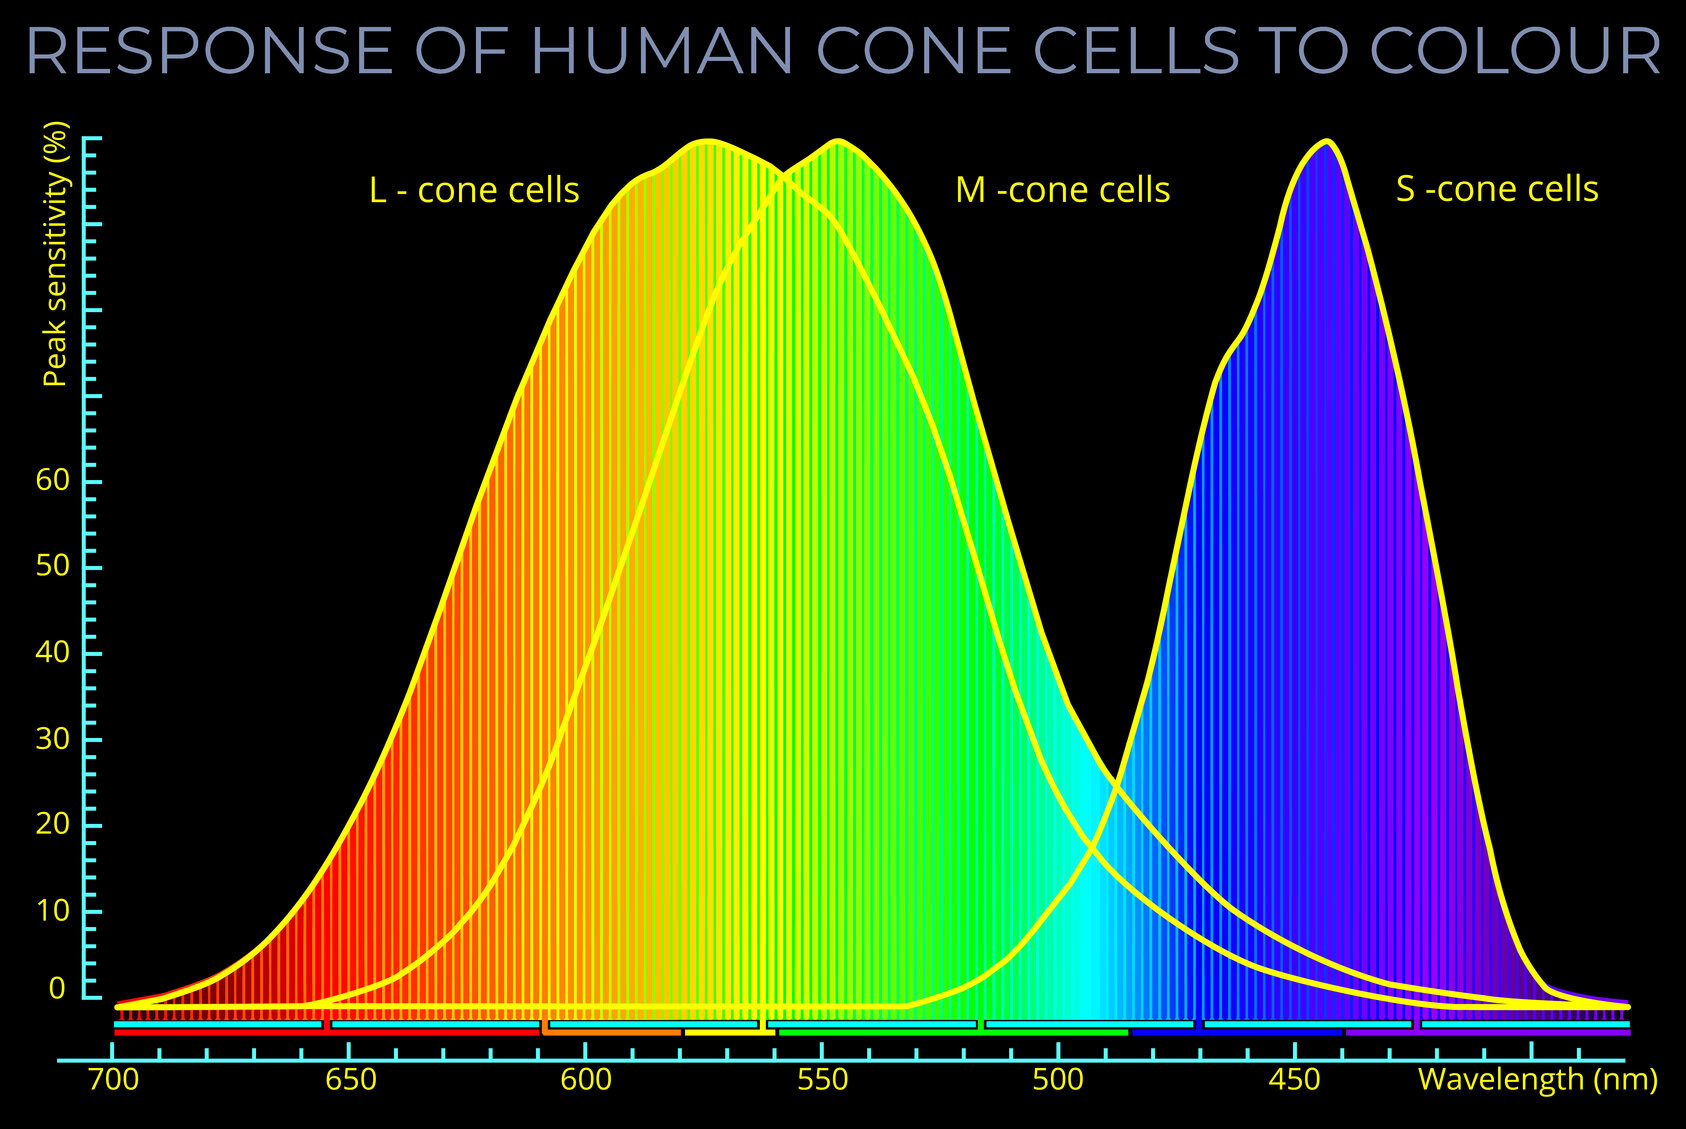
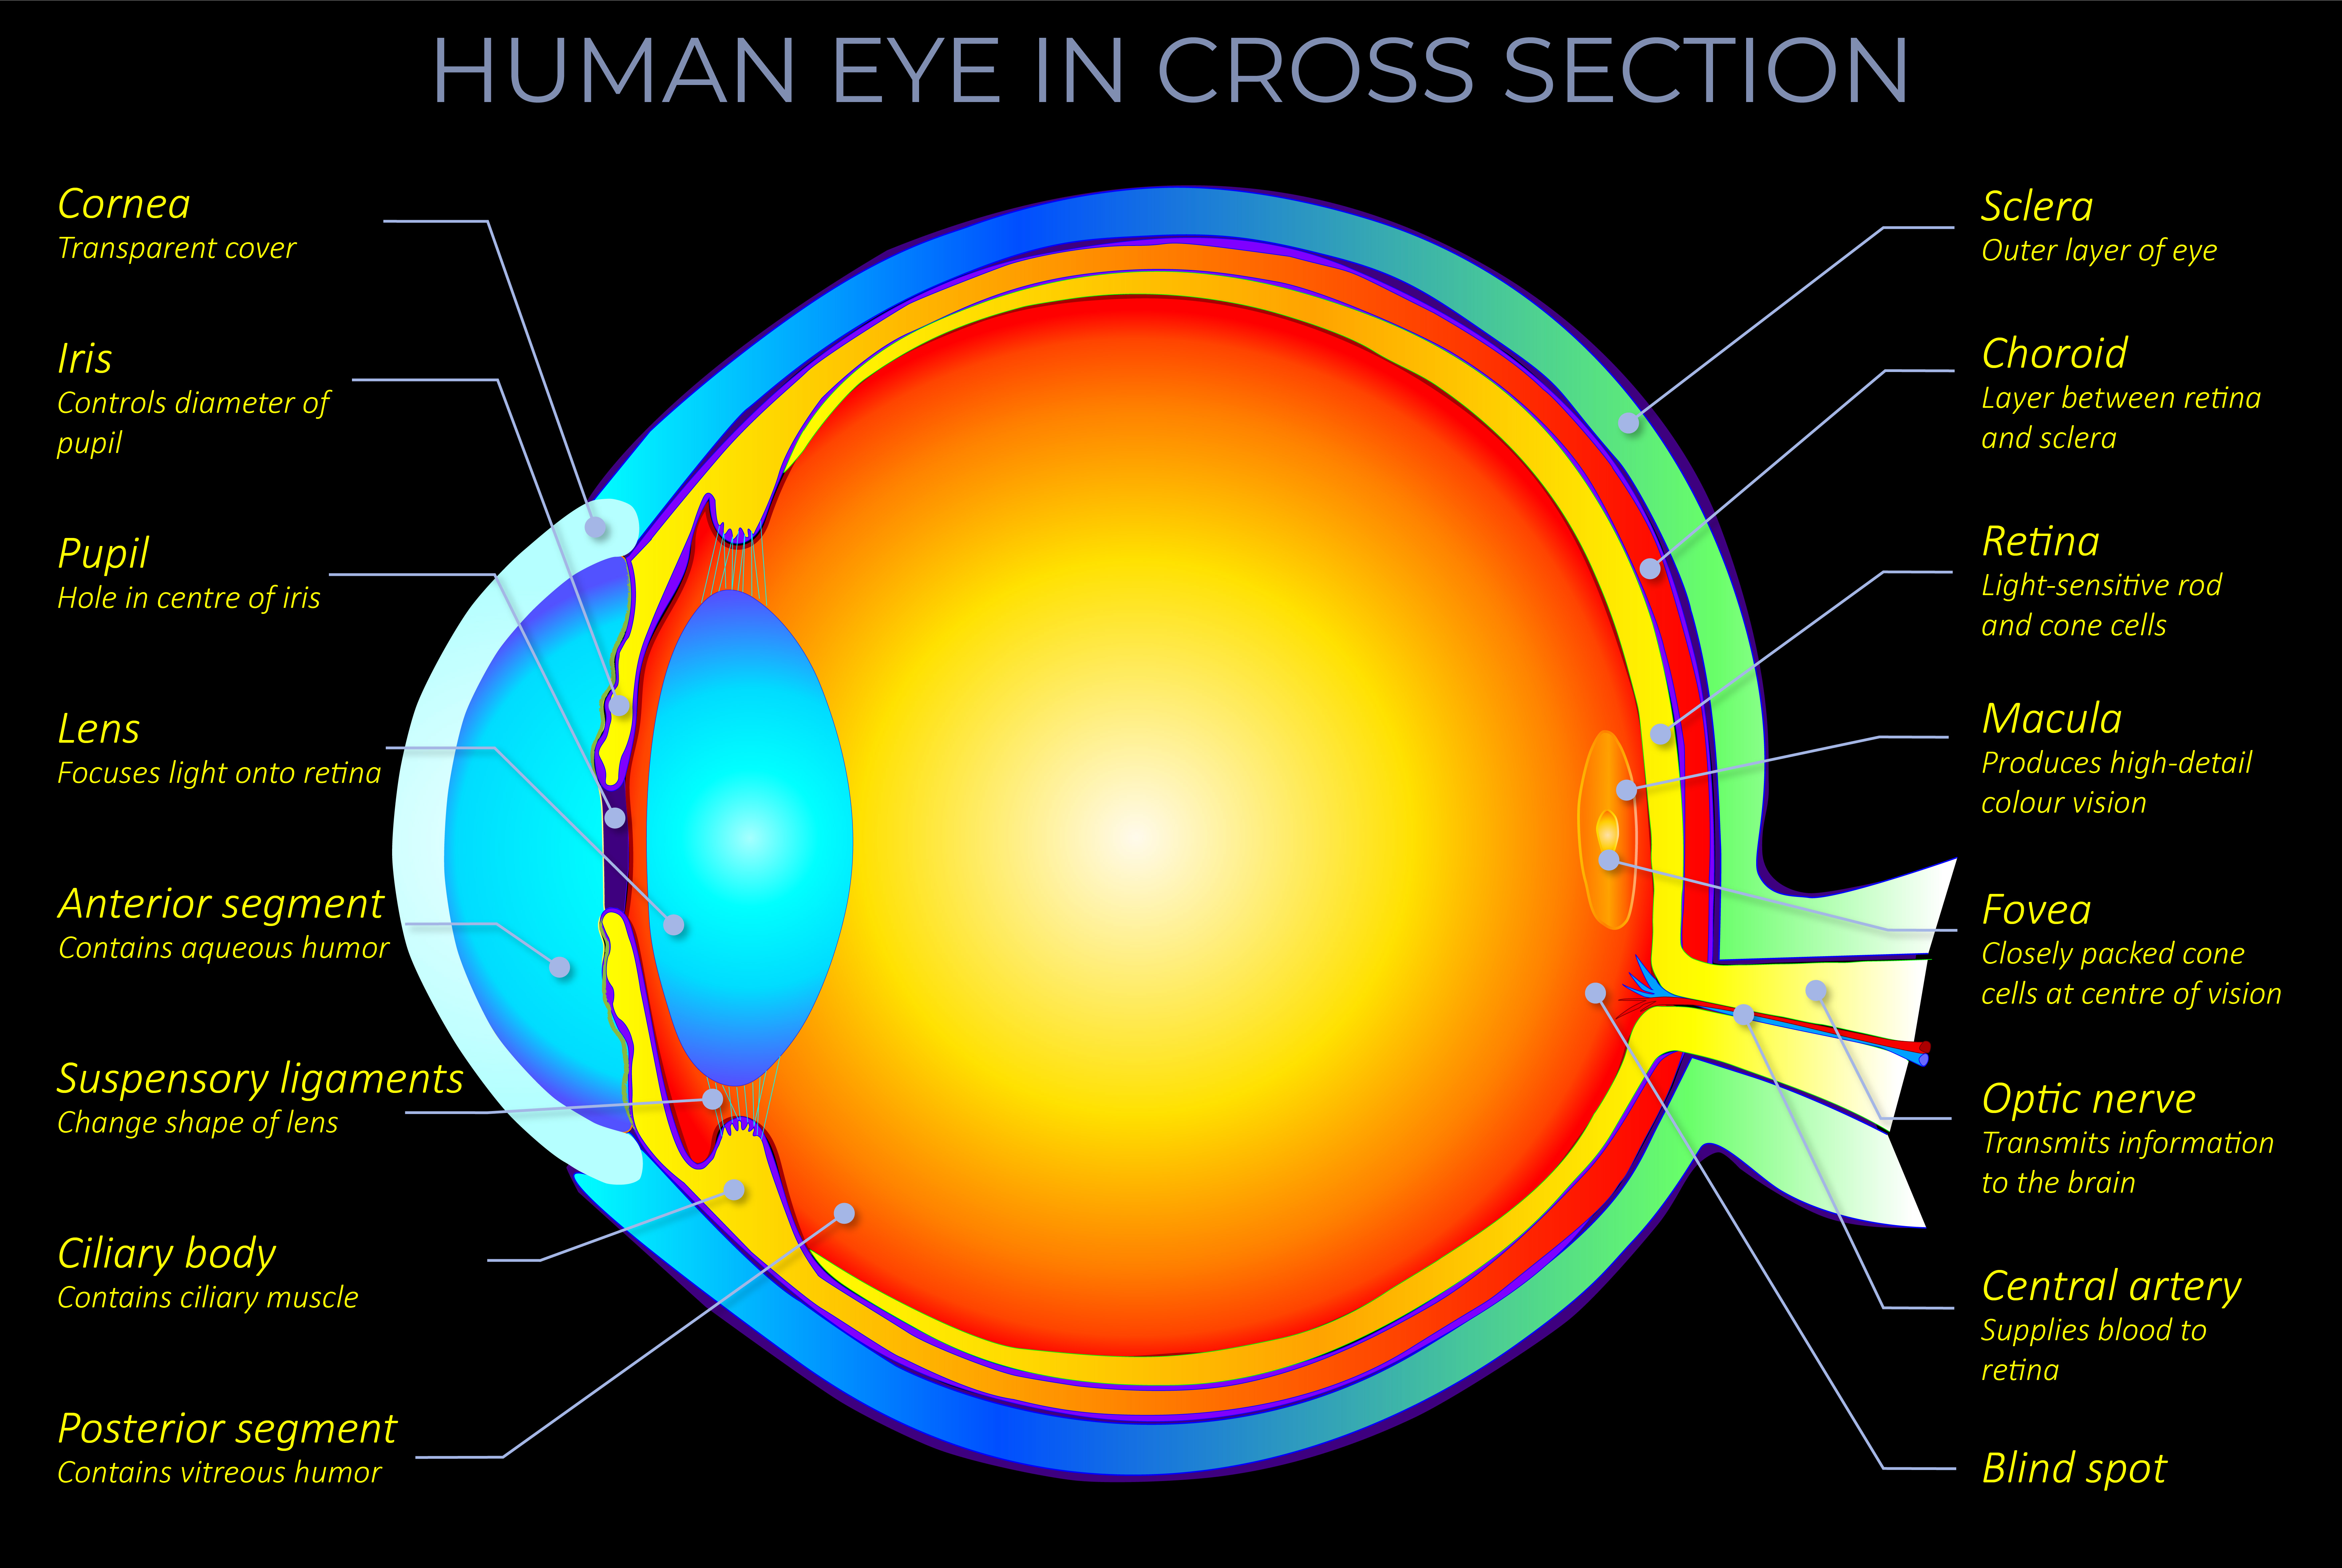
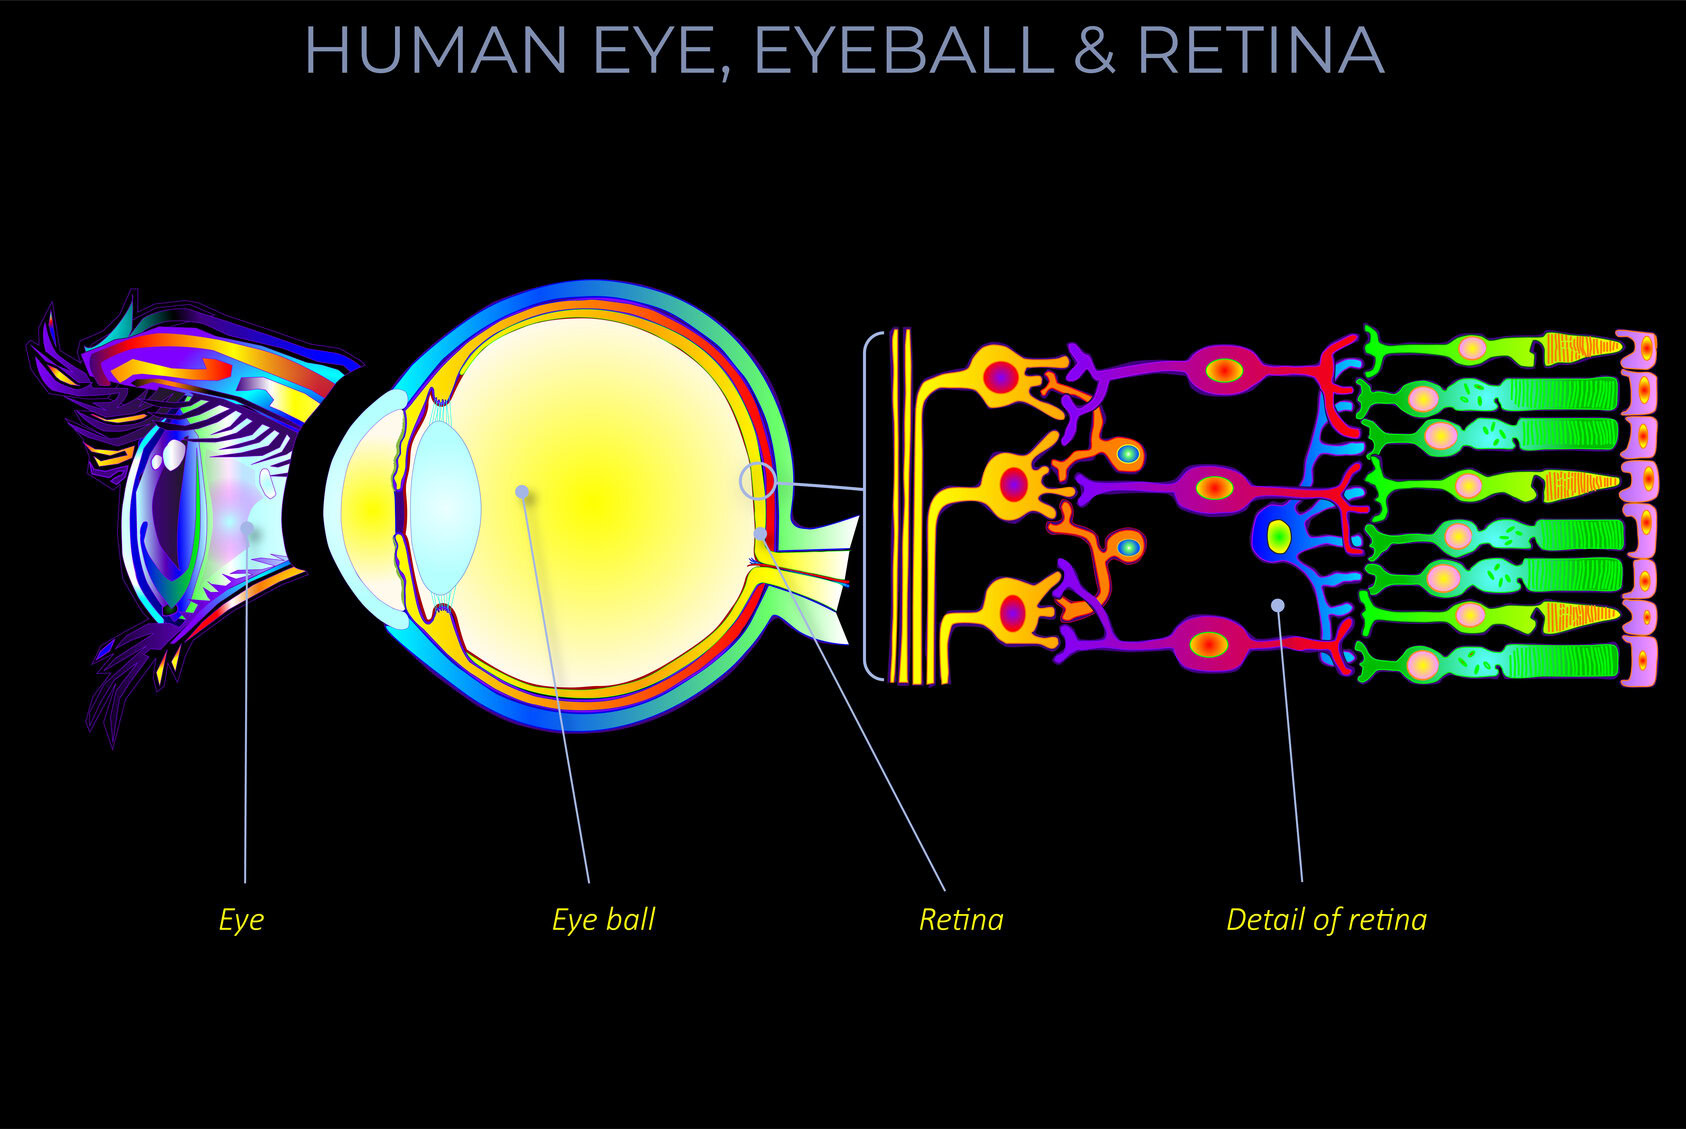
- SPD is critical in defining colour perception. The way the human eye perceives colour is heavily influenced by the distribution of power at various wavelengths, as different combinations of wavelengths will stimulate the cones in our retinas to varying degrees, resulting in a specific colour experience.
- SPD helps in identifying and comparing light sources. Different light sources, such as sunlight, LED lamps, or incandescent bulbs, have distinct SPDs. For instance, sunlight has a broad, continuous spectrum, while LEDs or fluorescent lights often have spikes at certain wavelengths, affecting how we perceive colour under these lights.
- SPD plays a key role in material appearance. When light reflects off a surface, the spectral power distribution of the reflected light reveals how different wavelengths are absorbed or reflected by the material, influencing the material’s colour and brightness.


